

Single-molecule sequence detection via microfluidic planar extensional flow at a stagnation point
- PMID: 20358051
- PMCID: PMC3322643
- DOI: 10.1039/b926847b
Single-molecule sequence detection via microfluidic planar extensional flow at a stagnation point
Abstract
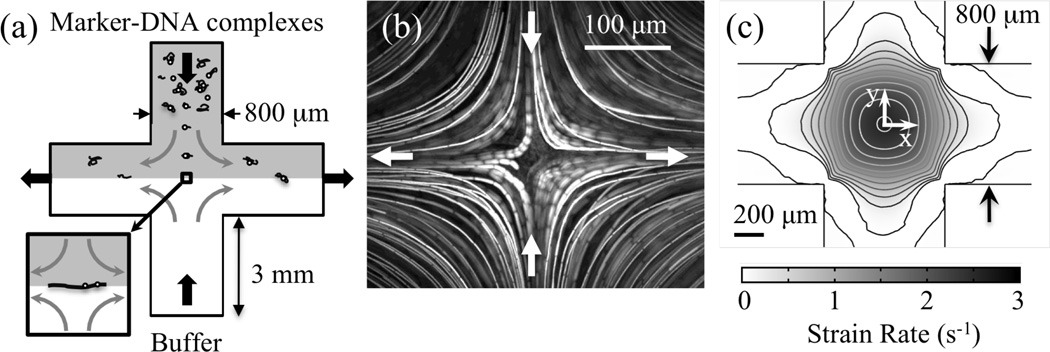
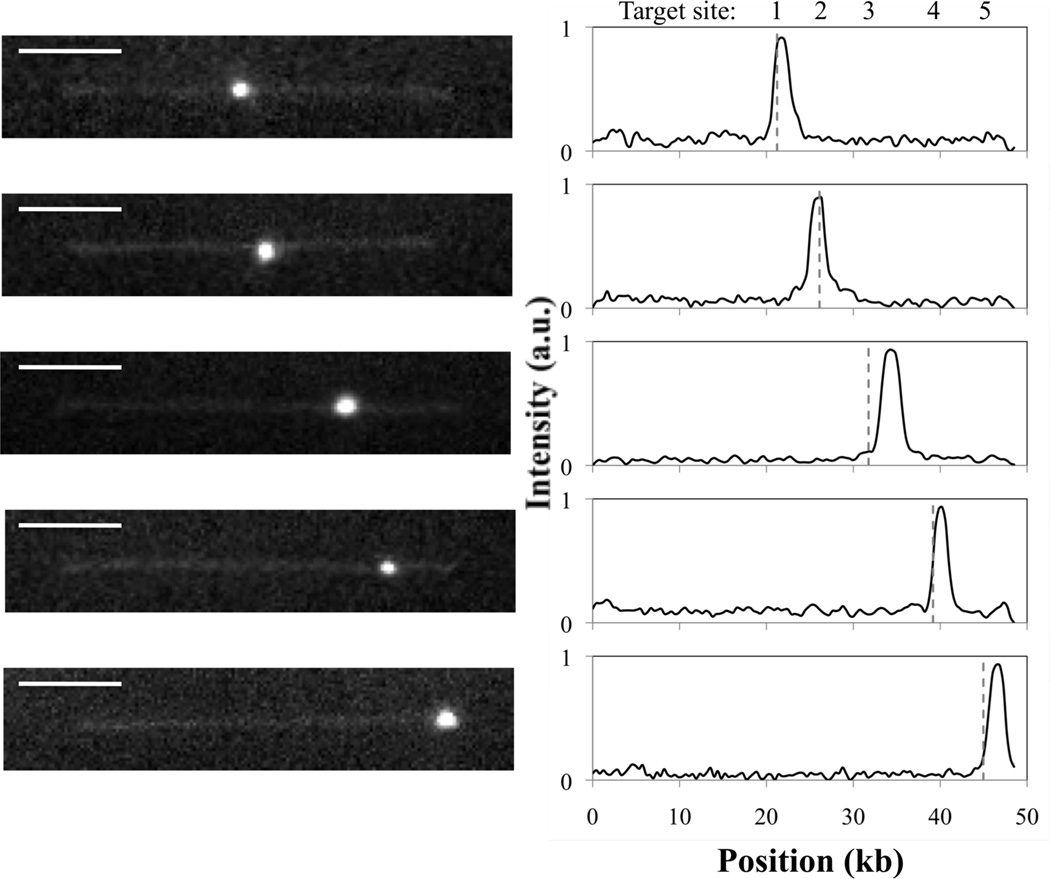
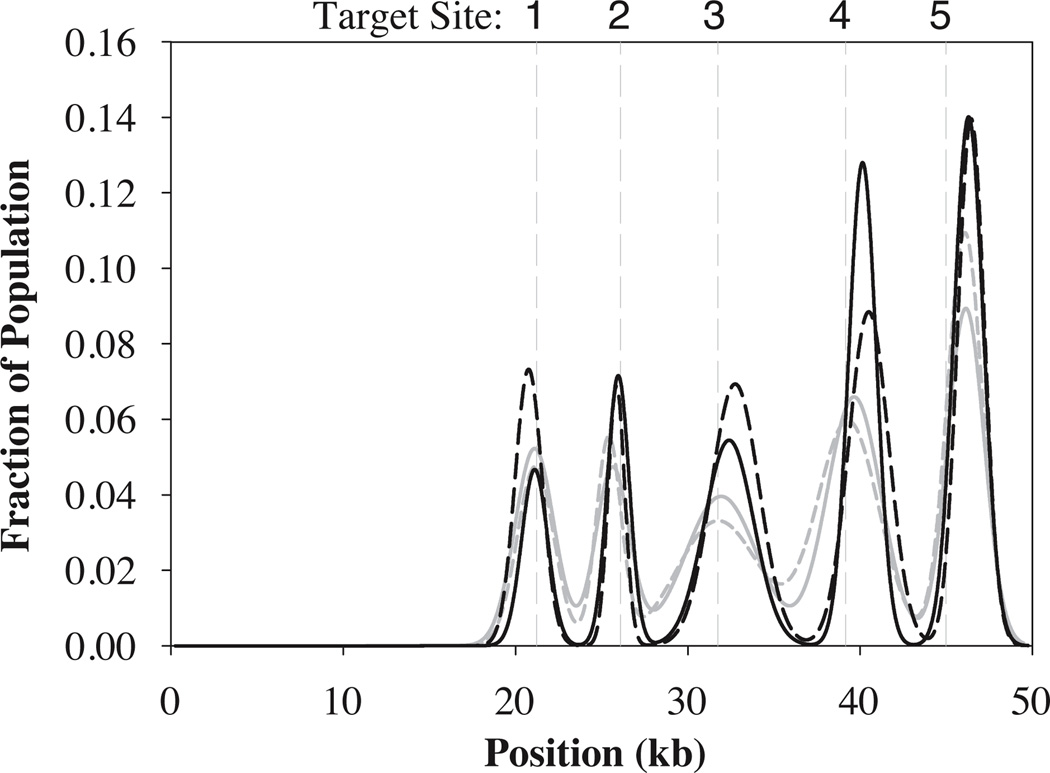
We demonstrate the use of a microfluidic stagnation point flow to trap and extend single molecules of double-stranded (ds) genomic DNA for detection of target sequences along the DNA backbone. Mutant EcoRI-based fluorescent markers are bound sequence-specifically to fluorescently labeled ds lambda-DNA. The marker-DNA complexes are introduced into a microfluidic cross slot consisting of flow channels that intersect at ninety degrees. Buffered solution containing the marker-DNA complexes flows in one channel of the cross slot, pure buffer flows in the opposing channel at the same flow rate, and fluid exits the two channels at ninety degrees from the inlet channels. This creates a stagnation point at the center of a planar extensional flow, where marker-DNA complexes may be trapped and elongated along the outflow axis. The degree of elongation can be controlled using the flow strength (i.e., a non-dimensional flow rate) in the device. Both the DNA backbone and the markers bound along the stretched DNA are observed directly using fluorescence microscopy, and the location of the markers along the DNA backbone is measured. We find that our method permits detection of each of the five expected target site positions to within 1.5 kb with standard deviations of <1.5 kb. We compare the method's precision and accuracy at molecular extensions of 68% and 88% of the contour length to binding distributions from similar data obtained via molecular combing. We also provide evidence that increased mixing of the sample during binding of the marker to the DNA improves binding to internal target sequences of dsDNA, presumably by extending the DNA and making the internal binding sites more accessible.
Figures


Similar articles
-
Exploring both sequence detection and restriction endonuclease cleavage kinetics by recognition site via single-molecule microfluidic trapping.Lab Chip. 2011 Feb 7;11(3):435-42. doi: 10.1039/c0lc00176g. Epub 2010 Nov 12. Lab Chip. 2011. PMID: 21072428 Free PMC article.
-
A microfluidic-based hydrodynamic trap for single particles.J Vis Exp. 2011 Jan 21;(47):2517. doi: 10.3791/2517. J Vis Exp. 2011. PMID: 21304467 Free PMC article.
-
Extensional flow of hyaluronic acid solutions in an optimized microfluidic cross-slot device.Biomicrofluidics. 2013 Jul 30;7(4):044108. doi: 10.1063/1.4816708. eCollection 2013 Jul. Biomicrofluidics. 2013. PMID: 24738010 Free PMC article.
-
Microfluidic extensional rheometry using stagnation point flow.Biomicrofluidics. 2016 Apr 5;10(4):043401. doi: 10.1063/1.4945604. eCollection 2016 Jul. Biomicrofluidics. 2016. PMID: 27099647 Free PMC article. Review.
-
Nanofluidic devices towards single DNA molecule sequence mapping.J Biophotonics. 2012 Aug;5(8-9):673-86. doi: 10.1002/jbio.201200050. Epub 2012 Jul 20. J Biophotonics. 2012. PMID: 22815200 Review.
Cited by
-
Hydrodynamic mechanisms of cell and particle trapping in microfluidics.Biomicrofluidics. 2013 Apr 5;7(2):21501. doi: 10.1063/1.4799787. Biomicrofluidics. 2013. PMID: 24404005 Free PMC article. Review.
-
Exploring both sequence detection and restriction endonuclease cleavage kinetics by recognition site via single-molecule microfluidic trapping.Lab Chip. 2011 Feb 7;11(3):435-42. doi: 10.1039/c0lc00176g. Epub 2010 Nov 12. Lab Chip. 2011. PMID: 21072428 Free PMC article.
-
Regulation of DNA conformations and dynamics in flows with hybrid field microfluidics.Biomicrofluidics. 2012 Oct 24;6(4):44103. doi: 10.1063/1.4762852. eCollection 2012. Biomicrofluidics. 2012. PMID: 24155864 Free PMC article.
-
Polymer-monovalent salt-induced DNA compaction studied via single-molecule microfluidic trapping.Lab Chip. 2012 Feb 7;12(3):647-51. doi: 10.1039/c2lc20880f. Epub 2011 Dec 16. Lab Chip. 2012. PMID: 22173785 Free PMC article.
-
Resolution limit for DNA barcodes in the Odijk regime.Biomicrofluidics. 2012 Mar;6(1):14101-141019. doi: 10.1063/1.3672691. Epub 2012 Jan 3. Biomicrofluidics. 2012. PMID: 22299023 Free PMC article.
References
-
- Tokuhiro S, Yamada R, Chang XT, Suzuki A, Kochi Y, Sawada T, Suzuki M, Nagasaki M, Ohtsuki M, Ono M, Furukawa H, Nagashima M, Yoshino S, Mabucchi A, Sekine A, Saito S, Takahashi A, Tsunoda T, Nakamura Y, Yamamoto K. Nature Genetics. 2003;35:341–348. - PubMed
-
- Bensimon A, Simon A, Chiffaudel A, Croquette V, Heslot F, Bensimon D. Science. 1994;265:2096–2098. - PubMed
Publication types
MeSH terms
Substances
Grants and funding
LinkOut - more resources
Full Text Sources
Other Literature Sources