. 2010 Apr 21;10(8):999-1004.
doi: 10.1039/b922365g. Epub 2010 Jan 26.

Building and manipulating neural pathways with microfluidics

Affiliations

Building and manipulating neural pathways with microfluidics

Yevgeny Berdichevsky et al. Lab Chip. .

Abstract

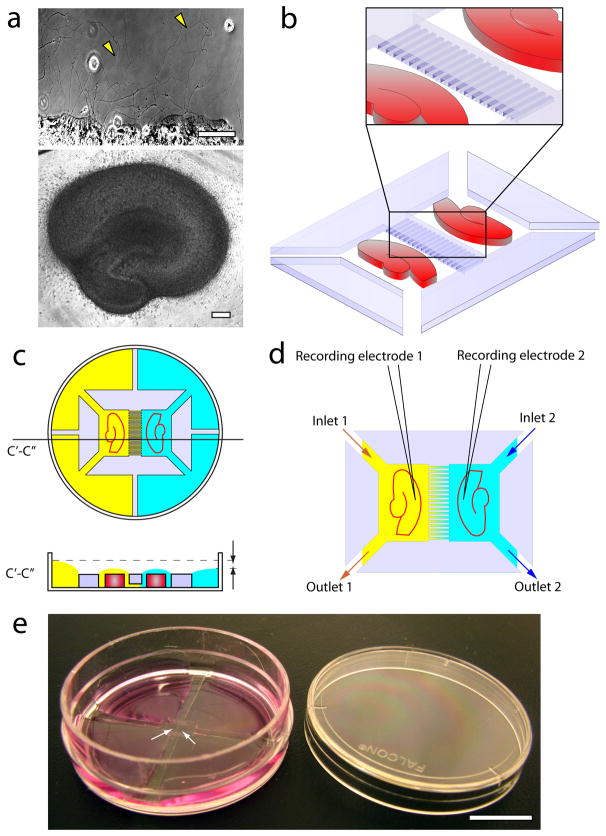
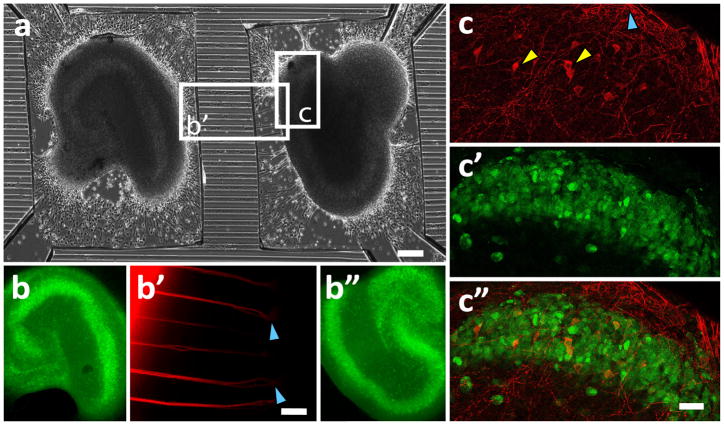
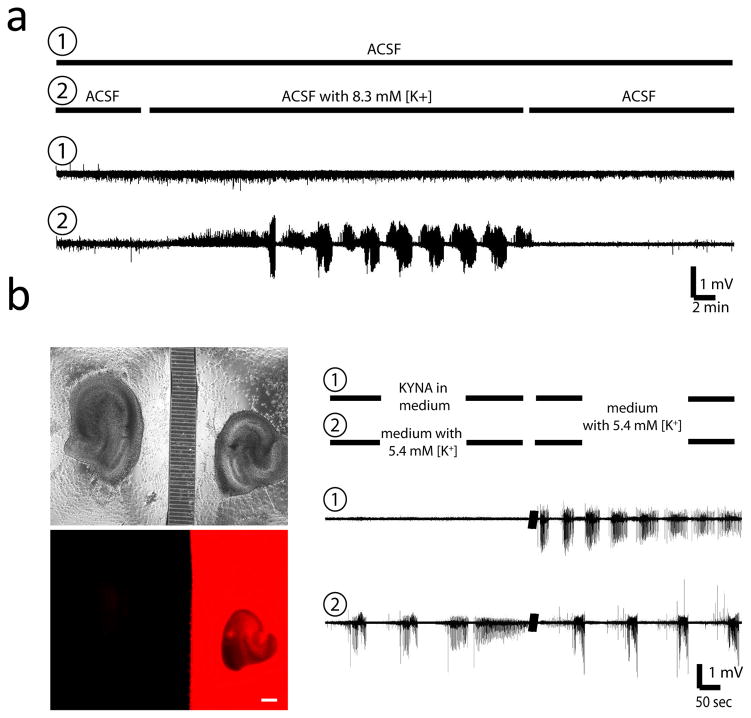
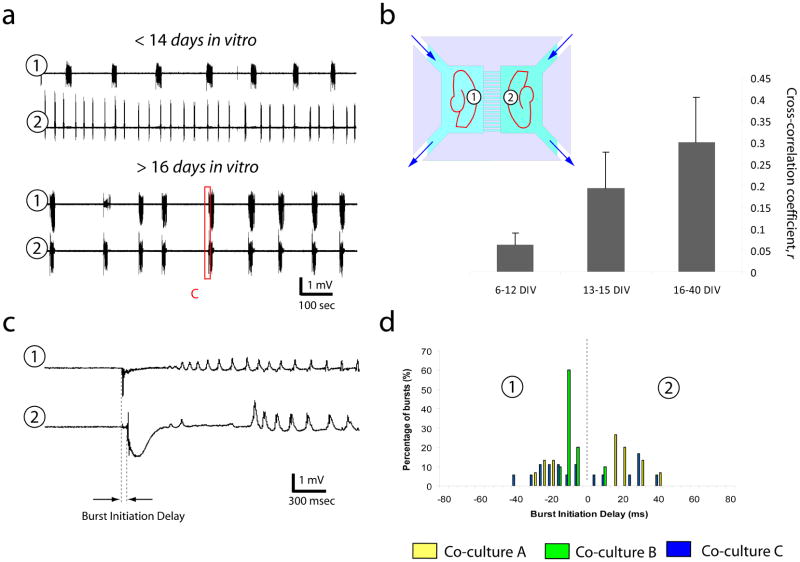
Communication between different brain regions, and between local circuits in the same brain region, is an important area of study for basic and translational neuroscience research. Selective and chronic manipulation of one of the components in a given neural pathway is frequently required for development and plasticity studies. We designed an in vitro platform that captures some of the complexity of mammalian brain pathways but permits easy experimental manipulation of their constituent parts. Organotypic cultures of brain slices were carried out in compartments interconnected by microchannels. We show that co-cultures from cortex and hippocampus formed functional connections by extending axons through the microchannels. We report synchronization of neural activity in co-cultures, and demonstrate selective pharmacological manipulation of activity in the constituent slices. Our platform enables chronic, spatially-restricted experimental manipulation of pre- and post-synaptic neurons in organotypic cultures, and will be useful to investigators seeking to understand development, plasticity, and pathologies of neural pathways.


Figures

Fig. 1
Fig. 1
Compartmented organotypic slice culture platform. (a) Organotypic hippocampal culture at 5 DIV (bottom), scale bar is 200 μm; axons and dendrites are extended by neurons within the slice beyond the slice border (top), arrows point to axons, scale bar is 100 μm, (b) Schematic of the hippocampus-hippocampus co-culture in compartments cut in a thick (150 μm) PDMS film. Microchannels (5 μm high, 50 μm wide) are imprinted into PDMS barrier separating the two slices via soft lithography. (c) PDMS compartments in a 35 mm Petri dish. The culture dish is separated into four quadrants with PDMS barriers, isolating solutions on the left and the right sides of the dish. During incubation, higher fluid level on the left side of the dish creates a pressure-driven flow from left to right, preventing diffusion of pharmaceuticals in the opposite direction. (d) During recording, extracellular electrodes are placed into both slices, which are superfused through separate fluid inlets and outlets. (e) Photograph of the culture platform (without the slices), consisting of microchannel-linked PDMS compartments and medium reservoirs built into a 35 mm Petri dish. The dish is filled with culture medium. Arrows point to the slice compartments. Scale bar is 10 mm.
Fig. 2
Fig. 2
Morphology of organotypic slices and axonal connections. (a) Phase contrast micrograph of two hippocampus slices in PDMS compartments at 18 DIV. Sidewalls of microchannels imprinted into the PDMS appear as bright horizontal lines. The channels are 50 μm wide with 50 μm channel-to-channel intervals, scale bar is 200 μm. (b, b″) The morphology of slices maintained in this preparation is typical of hippocampal organotypic cultures, including intact CA1, CA3, and DG, readily observed with anti-NeuN immunohistochemistry. (b′) The axons in microchannels, poorly visible with phase contrast optics, are brightly stained with DiI (red), crystals of DiI were placed on the left slice. Blue arrows show the point where axons split and enter the right slice. Scale bar is 50 μm. (c) FluoroRuby (red), a retrograde tracer dye, was applied to CA1 of one of the slices in the co-culture. The dye was transported in the retrograde directions through axons in microchannels, into the neurons (yellow arrows) in the other slice. Blue arrow shows axons exiting the slice toward the microchannels. (c′) The slice was counterstained with anti-NeuN (green) to reveal the position of the CA1 pyramidal layer. (c″) FluoroRuby-positive neurons were located in the CA1 pyramidal layer. Scale bar is 50 μm.
Fig. 3
Fig. 3
Acute and chronic fluidic isolation. (a) Slices in co-culture at 12 DIV were superfused through separate fluid channels as indicated. Slice 1 activity level stayed constant, while slice 2 developed epileptiform discharges when superfused with high [K+] containing ACSF. Activity in slice 2 returned to normal after [K+] washout. Co-cultures at 12 DIV are not yet functionally connected. (b) Phase contrast (top) and fluorescent (bottom) micrographs of the co-culture 2 days after rhodamine application to the right compartment. Rhodamine fluorescence (red) is contained in the right compartment, with no observed diffusion through the microchannels. Scale bar is 200 μm, (c) Co-culture with regular culture medium (including 5.4 mM [K+]) in compartment 2, and medium containing 2mM kynurenic acid in compartment 1, recorded at 10 DIV. No spontaneous activity is observed in slice 1, while slice 2 exhibits characteristic burst activity, indicating no diffusion of kynurenic acid from compartment 1 to compartment 2. When fresh medium, with no kynurenic acid, is placed on both slices, both exhibit spontaneous bursting.
Fig. 4
Fig. 4
Synchronization of activity in co-cultures. (a) Activity is recorded with extracellular electrodes in positions indicated by (1) and (2) while both slices are perfused with ACSF containing GABAA and GABAB antagonists (b, inset). Top trace shows a typical example of activity recorded in co-cultures at less than 14 DIV, with no synchronization of bursts between the two slices. Bottom trace shows typical recording from co-cultures older than 16 DIV. Burst timing is synchronized in slice 1 and slice 2. (b) Mean values of the cross-correlation coefficients between slice 1 and slice 2 are plotted for cultures at 6–12 DIV (n = 7 co-cultures), 13–15 DIV (n = 5 co-cultures), and 16–40 DIV (n = 7 co-cultures). Difference between r is very significant between age groups (p = 0.0011, Kruskal-Wallis test, values of r are very significantly different between 6–12 DIV and 16–40 DIV, p = 0.0006, Dunn’s post-hoc analysis). Error bars correspond to standard deviation from the mean cross-correlation coefficient. (c) Burst initiation delay was measured as the difference between the burst onset in slice 1 and slice 2. (d) Histogram of the burst initiation delays in 3 co-cultures. Negative delays indicate initiation in slice 1, while positive delays indicate initiation in slice 2.

References

    1. de Kloet ER, Joels M, Holsboer F. Nat Rev Neurosci. 2005;6:463–475. - PubMed
    1. Herman JP, Cullinan WE. Trends Neurosci. 1997;20:78–84. - PubMed
    1. Bliss T, Collingridge G, Morris R. In: The Hippocampus Book. Andersen P, Morris R, Amaral D, Bliss T, O’Keefe J, editors. Oxford University Press; New York: 2007. pp. 343–474.
    1. Scheibel ME, Crandall PH, Scheibel AB. Epilepsia. 1974;15:55–80. - PubMed
    1. Sutula T, Cascino G, Cavazos J, Parada I, Ramirez L. Ann Neurol. 1989;26:321–330. - PubMed

Publication types