Gene duplication and fragmentation in the zebra finch major histocompatibility complex
- PMID: 20359332
- PMCID: PMC2907588
- DOI: 10.1186/1741-7007-8-29
Gene duplication and fragmentation in the zebra finch major histocompatibility complex
Abstract
Background: Due to its high polymorphism and importance for disease resistance, the major histocompatibility complex (MHC) has been an important focus of many vertebrate genome projects. Avian MHC organization is of particular interest because the chicken Gallus gallus, the avian species with the best characterized MHC, possesses a highly streamlined minimal essential MHC, which is linked to resistance against specific pathogens. It remains unclear the extent to which this organization describes the situation in other birds and whether it represents a derived or ancestral condition. The sequencing of the zebra finch Taeniopygia guttata genome, in combination with targeted bacterial artificial chromosome (BAC) sequencing, has allowed us to characterize an MHC from a highly divergent and diverse avian lineage, the passerines.
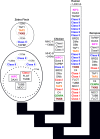
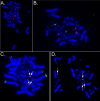
Results: The zebra finch MHC exhibits a complex structure and history involving gene duplication and fragmentation. The zebra finch MHC includes multiple Class I and Class II genes, some of which appear to be pseudogenes, and spans a much more extensive genomic region than the chicken MHC, as evidenced by the presence of MHC genes on each of seven BACs spanning 739 kb. Cytogenetic (FISH) evidence and the genome assembly itself place core MHC genes on as many as four chromosomes with TAP and Class I genes mapping to different chromosomes. MHC Class II regions are further characterized by high endogenous retroviral content. Lastly, we find strong evidence of selection acting on sites within passerine MHC Class I and Class II genes.
Conclusion: The zebra finch MHC differs markedly from that of the chicken, the only other bird species with a complete genome sequence. The apparent lack of synteny between TAP and the expressed MHC Class I locus is in fact reminiscent of a pattern seen in some mammalian lineages and may represent convergent evolution. Our analyses of the zebra finch MHC suggest a complex history involving chromosomal fission, gene duplication and translocation in the history of the MHC in birds, and highlight striking differences in MHC structure and organization among avian lineages.
Figures


Similar articles
-
Genetic mapping of the major histocompatibility complex in the zebra finch (Taeniopygia guttata).Immunogenetics. 2011 Aug;63(8):523-30. doi: 10.1007/s00251-011-0525-9. Epub 2011 Apr 15. Immunogenetics. 2011. PMID: 21494955
-
Genomic organization of the crested ibis MHC provides new insight into ancestral avian MHC structure.Sci Rep. 2015 Jan 22;5:7963. doi: 10.1038/srep07963. Sci Rep. 2015. PMID: 25608659 Free PMC article.
-
Comparison of the chicken and zebra finch Z chromosomes shows evolutionary rearrangements.Chromosome Res. 2006;14(8):805-15. doi: 10.1007/s10577-006-1082-1. Epub 2007 Jan 19. Chromosome Res. 2006. PMID: 17139532
-
Comparative genomic analysis of the MHC: the evolution of class I duplication blocks, diversity and complexity from shark to man.Immunol Rev. 2002 Dec;190:95-122. doi: 10.1034/j.1600-065x.2002.19008.x. Immunol Rev. 2002. PMID: 12493009 Review.
-
Toward an evolutionary genomics of the avian Mhc.Immunol Rev. 1999 Feb;167:119-32. doi: 10.1111/j.1600-065x.1999.tb01386.x. Immunol Rev. 1999. PMID: 10319255 Review.
Cited by
-
Defense genes missing from the flight division.Dev Comp Immunol. 2013 Nov;41(3):377-88. doi: 10.1016/j.dci.2013.04.010. Epub 2013 Apr 24. Dev Comp Immunol. 2013. PMID: 23624185 Free PMC article. Review.
-
Characterization and 454 pyrosequencing of major histocompatibility complex class I genes in the great tit reveal complexity in a passerine system.BMC Evol Biol. 2012 May 15;12:68. doi: 10.1186/1471-2148-12-68. BMC Evol Biol. 2012. PMID: 22587557 Free PMC article.
-
Characterization of MHC class I in a long-distance migrant shorebird suggests multiple transcribed genes and intergenic recombination.Immunogenetics. 2013 Mar;65(3):211-25. doi: 10.1007/s00251-012-0669-2. Epub 2012 Dec 14. Immunogenetics. 2013. PMID: 23239370
-
Adaptive molecular evolution of the Major Histocompatibility Complex genes, DRA and DQA, in the genus Equus.BMC Evol Biol. 2011 May 18;11:128. doi: 10.1186/1471-2148-11-128. BMC Evol Biol. 2011. PMID: 21592397 Free PMC article.
-
Evolutionary history of black grouse major histocompatibility complex class IIB genes revealed through single locus sequence-based genotyping.BMC Genet. 2013 Apr 24;14:29. doi: 10.1186/1471-2156-14-29. BMC Genet. 2013. PMID: 23617616 Free PMC article.
References
-
- Zinkernagel RM, Doherty PC. MHC-restricted cytotoxic T cells: studies on the biological role of polymorphic major transplantation antigens determining T-cell restriction-specificity, function and responsiveness. Adv Immunol. 1979;27:52–277. - PubMed
Publication types
MeSH terms
Grants and funding
- BB/E010652/1/BB_/Biotechnology and Biological Sciences Research Council/United Kingdom
- BB/E024211/1/BB_/Biotechnology and Biological Sciences Research Council/United Kingdom
- BBS/E/D/05191130/BB_/Biotechnology and Biological Sciences Research Council/United Kingdom
- T32DC006612/DC/NIDCD NIH HHS/United States
LinkOut - more resources
Full Text Sources
Research Materials
Miscellaneous

