. 2010 May 28;285(22):16978-90.
doi: 10.1074/jbc.M109.096552. Epub 2010 Apr 1.

Cdc25 phosphatases are required for timely assembly of CDK1-cyclin B at the G2/M transition

Affiliations

Cdc25 phosphatases are required for timely assembly of CDK1-cyclin B at the G2/M transition

Oleg Timofeev et al. J Biol Chem. .

Abstract

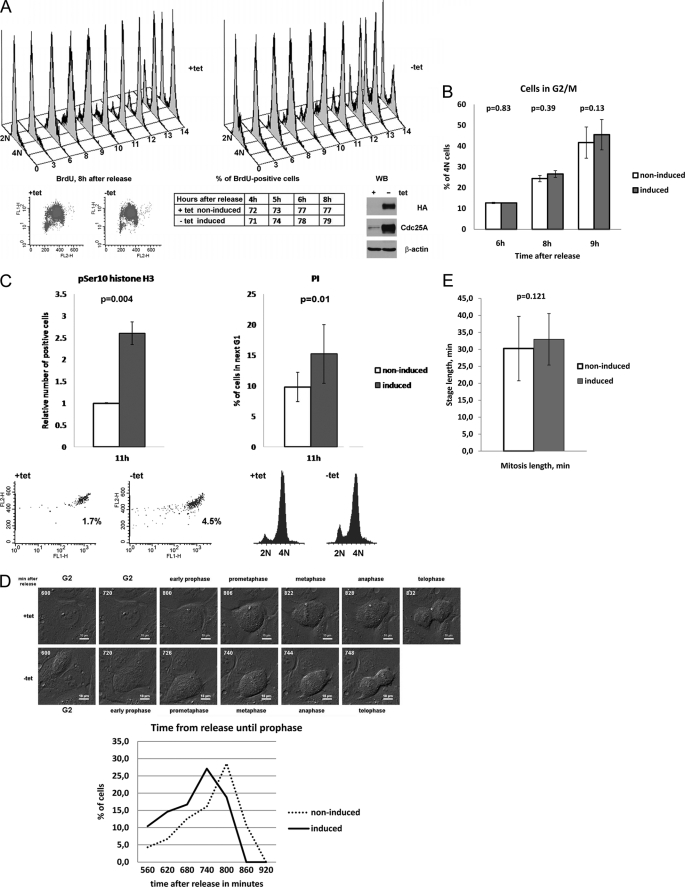
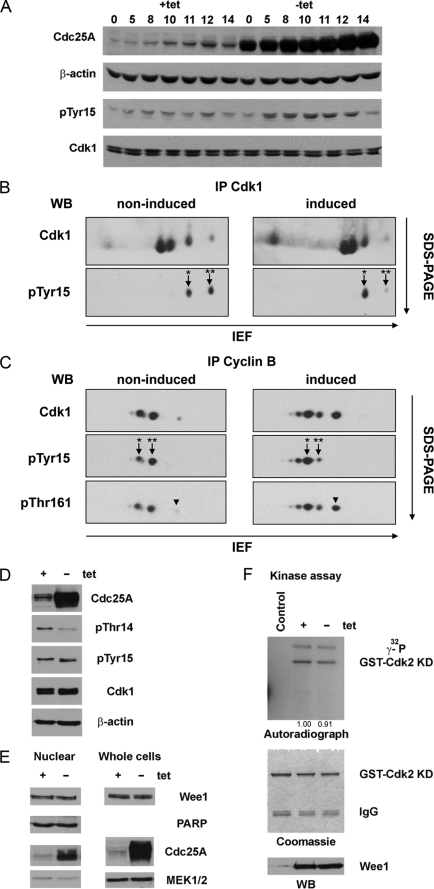
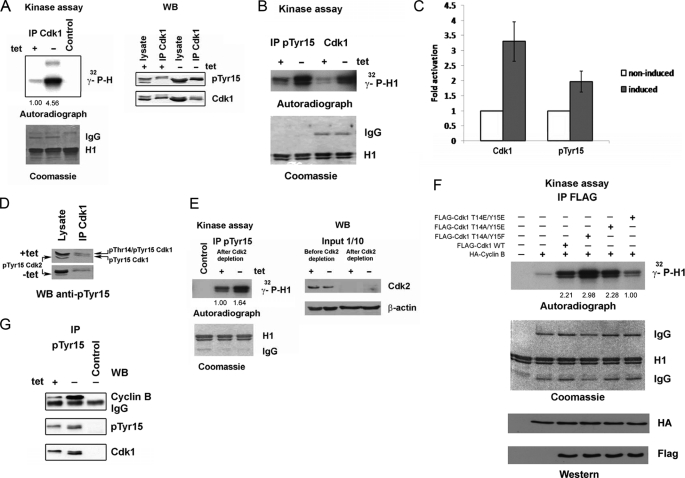
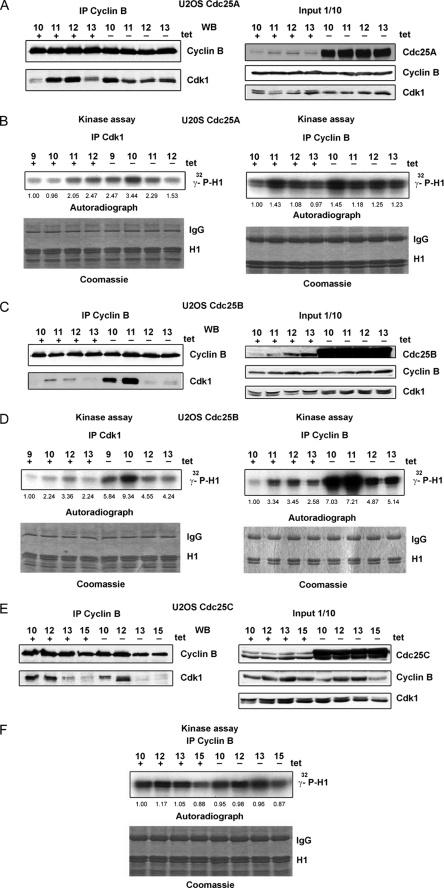
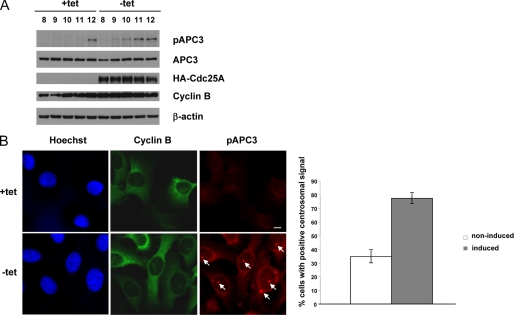
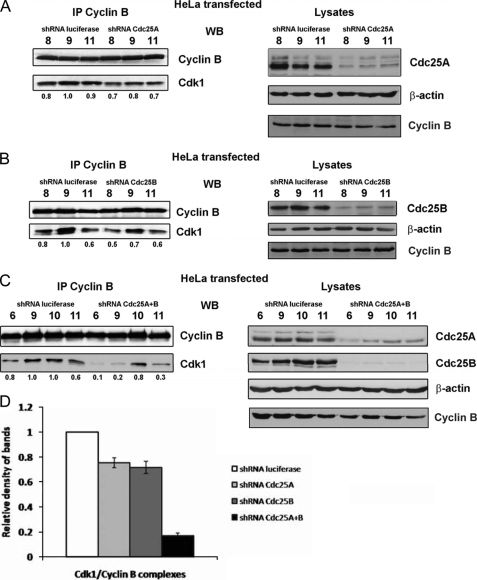
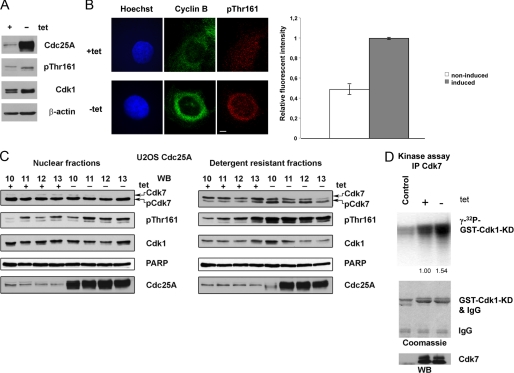
Progression through mitosis requires the coordinated regulation of Cdk1 kinase activity. Activation of Cdk1 is a multistep process comprising binding of Cdk1 to cyclin B, relocation of cyclin-kinase complexes to the nucleus, activating phosphorylation of Cdk1 on Thr(161) by the Cdk-activating kinase (CAK; Cdk7 in metazoans), and removal of inhibitory Thr(14) and Tyr(15) phosphorylations. This dephosphorylation is catalyzed by the dual specific Cdc25 phosphatases, which occur in three isoforms in mammalian cells, Cdc25A, -B, and -C. We find that expression of Cdc25A leads to an accelerated G(2)/M phase transition. In Cdc25A-overexpressing cells, Cdk1 exhibits high kinase activity despite being phosphorylated on Tyr(15). In addition, Tyr(15)-phosphorylated Cdk1 binds more cyclin B in Cdc25A-overexpressing cells compared with control cells. Consistent with this observation, we demonstrate that in human transformed cells, Cdc25A and Cdc25B, but not Cdc25C phosphatases have an effect on timing and efficiency of cyclin-kinase complex formation. Overexpression of Cdc25A or Cdc25B promotes earlier assembly and activation of Cdk1-cyclin B complexes, whereas repression of these phosphatases by short hairpin RNA has a reverse effect, leading to a substantial decrease in amounts of cyclin B-bound Cdk1 in G(2) and mitosis. Importantly, we find that Cdc25A overexpression leads to an activation of Cdk7 and increase in Thr(161) phosphorylation of Cdk1. In conclusion, our data suggest that complex assembly and dephosphorylation of Cdk1 at G(2)/M is tightly coupled and regulated by Cdc25 phosphatases.


Figures

FIGURE 1.
FIGURE 1.
Overexpression of Cdc25A leads to shortened G2 phase and early mitotic onset. A, U2OS cells with stable inducible expression of Cdc25A were synchronized at G1/S using a double thymidine block and then released as described under “Experimental Procedures.” After pulse-labeling with BrdUrd, cells were collected, fixed, and subjected to staining with anti-BrdUrd antibodies and PI. The top panels show DNA content-based cell cycle profiles in non-induced (+tet; left) and induced (−tet; right) cells. The lower left panels demonstrate the absence of a significant difference between BrdUrd-positive populations in non-induced and induced cells at 8 h after release; the middle lower table shows quantified data for sequential time points from 4 to 8 h after release; a WB in the lower right panel illustrates levels of Cdc25A protein in non-induced and induced states. Representative results of one of three experiments are shown. B, quantifications of four independent FACS-assisted measurements of DNA content during cell cycle progression in synchronized U2OS cells. Results were analyzed using a paired t test, p for 95% confidence interval indicated above the graphs. Note the absence of a significant difference in rate of accumulation of cells with completed DNA replication (4N). C, U2OS Cdc25A cells were collected at different time intervals after release, fixed, and stained with the anti-phospho-Ser10 histone H3 antibody and propidium iodide. The quantification of three independent series of FACS-assisted measurements is shown (a representative time point, 11 h, was selected) for phospho-H3 (pH3)-positive cells (upper left panel) and 2 n cells in the next G1 phase (upper right panel). The lower panels represent the volume of pH3-positive population (left) and DNA profiles (right) in non-induced (+tet) and induced (−tet) cells at 11 h after release. D, U2OS Cdc25A cells were released from a double-thymidine block and monitored using differential interference contrast microscopy. The beginning of characteristic rounding of cells was considered as the onset of mitosis because soon after that, condensation of DNA was observed. Top, still photographs of one representative non-induced and induced cell are shown. The numbers indicate the time from release in minutes (scale bars, 10 μm). Bottom, durations of time from release to prophase for each individual cell were grouped into six intervals. The percentage of prophase cells at each interval is shown (non-induced, n = 51; induced, n = 46). pSer10, Ser(P)10. E, U2OS Cdc25A cells were released from a double-thymidine block and monitored using differential interference contrast microscopy. Duration of mitosis was measured for 51 induced and 46 non-induced cells as described in the text. Results were analyzed using paired t-test; p for 95% confidence interval is indicated above the graphs.
FIGURE 2.
FIGURE 2.
In Cdc25A-overexpressing cells, the major pool of cyclin B-bound Cdk1 kinase is phosphorylated on Tyr15 at G2/M. A, U2OS Cdc25A cells were synchronized as in Fig. 2, and samples for WB were collected at the indicated time points and probed with respective antibodies. Note the increase in the Tyr(P)15 (pTyr15) band intensity in induced cells. B, Cdk1 was immunoprecipitated from lysates of U2OS Cdc25A cells collected at 10 h after release. Proteins were resolved on two-dimensional PAGE and analyzed using anti-Cdk1 and anti-Tyr(P)15 antibodies. Asterisks correspond to double-phosphorylated Thr(P)14/Tyr(P)15 (**) and monophosphorylated Tyr(P)15 Cdk1 (*). The arrowheads mark phosphorylation of Cdk1 on Thr161 (pThr161). C, cyclin B-bound Cdk1 was co-immunoprecipitated using the anti-cyclin B antibody, and protein complexes were resolved and analyzed as in A using the indicated antibodies. D, the same lysates as in B and C were resolved using SDS-PAGE and analyzed by WB with the respective antibodies. E, nuclear extracts and lysates of detergent-resistant fractions of non-induced and induced U2OS Cdc25A cells were analyzed by immunoblotting. The figure represents WB of lysates prepared from cells collected at 10 h after release. F, the same lysates as in E were used for IP with the anti-Wee1 antibody or rabbit IgG as a control. After binding to Protein A-Sepharose beads (Amersham Biosciences), immunoprecipitates were split for kinase assay (top) and WB (bottom). The middle panel shows equal loading of the substrate (catalytically inactive purified GST-Cdk2 K33T/K34S). IEF, isoelectric focusing. PARP, poly(ADP-ribose) polymerase.
FIGURE 3.
FIGURE 3.
Partially dephosphorylated Tyr(P)15 Cdk1 is catalytically active. A, Cdk1 was immunoprecipitated from 500 μg of lysates of U2OS Cdc25A cells, collected at 10 h after release. Samples were split and used for immunoblotting (right) or kinase assays (left). Note the high levels of Tyr15 (pTyr15) phosphorylation and Cdk1 kinase activity in induced cells. B, same lysates as in A were used for IP with the anti-Tyr(P)15 or anti-Cdk1 antibody and split for subsequent H1 kinase assays and WB (G). C, quantifications of relative kinase activities of Cdk1 in non-induced and induced U2OS cells. The kinase was immunoprecipitated using anti-Cdk1 or anti-Tyr(P)15 antibodies. Activity in non-induced cells was considered as 1; n = 3. Error bars, S.D. D, lysates and Cdk1 immunoprecipitates prepared as in A were immunoblotted with the anti-Tyr(P)15 antibody. E, the same lysates as above were depleted of Cdk2 kinase by two rounds of immunoprecipitations, and efficiency of depletion was controlled by immunoblotting (right). After depletion, IP with the anti-Tyr(P)15 antibody was performed, and the kinase activity of immunoprecipitates was assessed in an H1 kinase assay (left). F, 293T cells were co-transfected with pCDNA3.1(+)-FLAG-Cdk1 WT or the indicated mutants and pCDNA3.1(+)-HA-cyclin B1; amounts of DNA were equilibrated using the empty vector pCDNA3.1(+). After 24 h post-transfection, cells were lysed, and immunoprecipitations using the anti-FLAG M2 antibody were performed and used for H1 kinase assays. G, immunoprecipitates obtained using the anti-Tyr(P)15 (B) were probed in WB with the indicated antibodies. Note the substantial increase in amounts of cyclin B co-immunoprecipitated with Tyr(P)15 Cdk1 from induced cells.
FIGURE 4.
FIGURE 4.
Overexpression of Cdc25A or Cdc25B but not Cdc25C induces an earlier Cdk1-cyclin B complex assembly and activation. A, immunoprecipitations obtained with anti-cyclin B antibodies from 500 μg of lysates of synchronized U2OS Cdc25A cells were used for WB. The right panel shows protein levels in 50 μg of lysates used for IP, detected by WB with the indicated antibodies. B, kinase assays were performed with immunoprecipitations obtained using anti-cyclin B or anti-Cdk1 antibodies from the same lysates as in A. C and D, similar to A and B, but lysates from synchronized inducible U2OS cells expressing Cdc25B were used. E and F, similar to A and B, but lysates from synchronized inducible U2OS cells expressing Cdc25C were used.
FIGURE 5.
FIGURE 5.
Overexpression of Cdc25A correlates with earlier phosphorylation of APC3 on Thr244. A, U2OS Cdc25A cells were released from a double thymidine block (left), and samples for WB were collected at the indicated time points (hours) and probed with the respective antibodies. Note the earlier appearance of the APC3-Thr(P)244 signal in induced cells. B, induced and non-induced U2OS Cdc25A cells were fixed on coverslips 9 h after release from a double thymidine block (left). Cells were stained with anti-cyclin B (green) and anti-APC3-Thr(P)244 (red) antibodies. DNA was stained with Hoechst (blue). Scale bar, 10 μm. The arrows indicate the Thr(P)244 signal decorating the centrosomes. Right, the percentage of cells with a positive centrosomal Thr(P)244 signal for Cdc25A induced and non-induced cells. Error bars, S.D. in three independent experiments (n = 200).
FIGURE 6.
FIGURE 6.
Repression of Cdc25A or Cdc25B by shRNA impairs Cdk1-cyclin B complex assembly. A, HeLa cells were transfected with plasmids, encoding shRNA targeting Cdc25A or firefly luciferase as a control and, 24 h after transfection, were synchronized by a double thymidine block. After release, cells were collected at different time intervals and used for FACS to confirm synchronization and trace stages of the cell cycle (not shown) and for preparation of lysates. Left, cyclin B was immunoprecipitated from 500 μg of lysates using the antibodies indicated, and proteins were resolved on SDS-PAGE and analyzed by WB. Density of Cdk1 bands was measured using ImageJ software, and their relative intensities were calculated as the ratio to the density of the Cdk1 band at 9 h after release (mitosis), considered as 1. Results are indicated below the Cdk1 blots. Right, 50 μg of lysates used for IP analyzed by WB to monitor repression of Cdc25A and evenness of loading. B, similar to A, but plasmids expressing shRNA against Cdc25B phosphatase were used. C, similar to A and B, but both Cdc25A and Cdc25B were repressed using corresponding shRNA-expressing constructs. D, data of relative density measurements at time point 9 h were used for statistical analysis in three independent experiments. Error bars, S.D.
FIGURE 7.
FIGURE 7.
Overexpression of Cdc25A correlates with increased electrophoretic mobility of Cdk7. A, lysates of U2OS Cdc25A synchronized cells, collected at 10 h after release from a double thymidine block, were analyzed by immunoblotting with the indicated antibodies. Note a shift of the Thr(P)161 (pThr161) band in induced cells, corresponding to Tyr15/Thr161-phosphorylated Cdk1, in comparison with Thr(P)14/Tyr(P)15/Thr(P)161 phosphorylated in non-induced cells, and a slight increase in Thr161 phosphorylation upon overexpression of Cdc25A. B, induced and non-induced U2OS Cdc25A cells were fixed on coverslips 9 h after release from a double thymidine block (left). Cells were stained with anti-cyclin B (green) and anti-Cdk1-Thr(P)161 (red) antibodies. DNA was stained with Hoechst (blue). Scale bar, 10 μm. On the right, relative signal intensities of anti-Thr(P)161 stainings for ∼50 cells were determined. Error bars, S.D. in three independent experiments. C, nuclear (left) and detergent-resistant fractions (right) from cells synchronized as in A. Extracts from U2OS Cdc25A cells were resolved using SDS-PAGE and probed with denoted antibodies. Note that in detergent-resistant fractions obtained from induced cells, the faster migrating Cdk7 bands are more abundant than in those from non-induced cells. Phospho-Thr161 Cdk1 (upper band) is also increased in these extracts upon Cdc25A overexpression. The lower bands in Thr(P)161 immunoblots correspond to Thr(P)160 Cdk2, also recognized by the antibody used. D, Cdk7 was immunoprecipitated from 500 μg of lysates prepared as in A and IP were split for immunoblotting (bottom) and kinase assays using catalytically inactive GST-Cdk1 (GST-Cdk1-KD) as a substrate (top). As a control, mouse IgGs were used.

Similar articles

Cited by

References

    1. Draetta G., Beach D. (1988) Cell 54, 17–26 - PubMed
    1. Riabowol K., Draetta G., Brizuela L., Vandre D., Beach D. (1989) Cell 57, 393–401 - PubMed
    1. Pines J., Hunter T. (1990) Nature 346, 760–763 - PubMed
    1. Pines J., Hunter T. (1992) Ciba Found. Symp. 170, 187–196; discussion 196–204 - PubMed
    1. Ducommun B., Brambilla P., Félix M. A., Franza B. R., Jr., Karsenti E., Draetta G. (1991) EMBO J. 10, 3311–3319 - PMC - PubMed

Publication types