. 2010 Apr 2;328(5974):67-73.
doi: 10.1126/science.1185954.

A gating charge transfer center in voltage sensors

Affiliations

A gating charge transfer center in voltage sensors

Xiao Tao et al. Science. .

Abstract

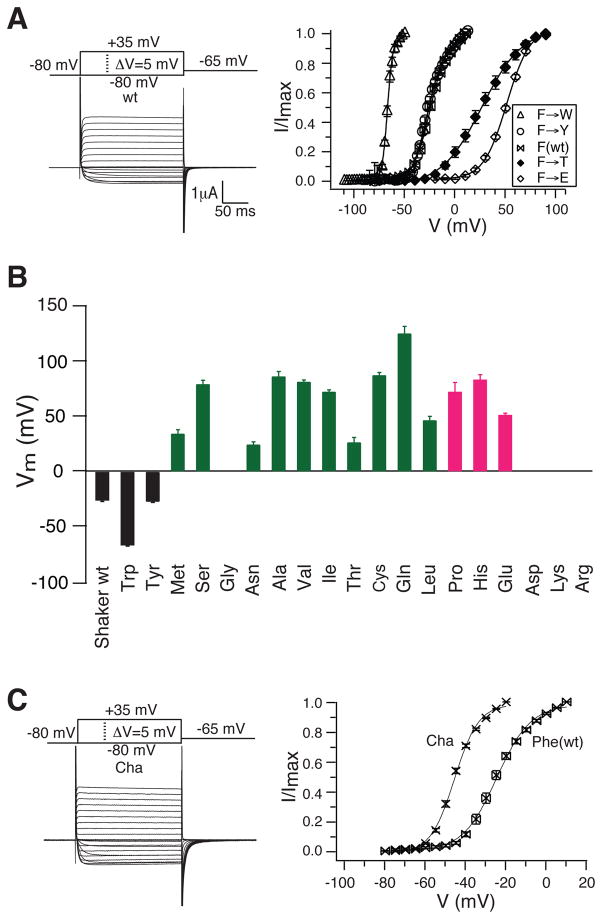
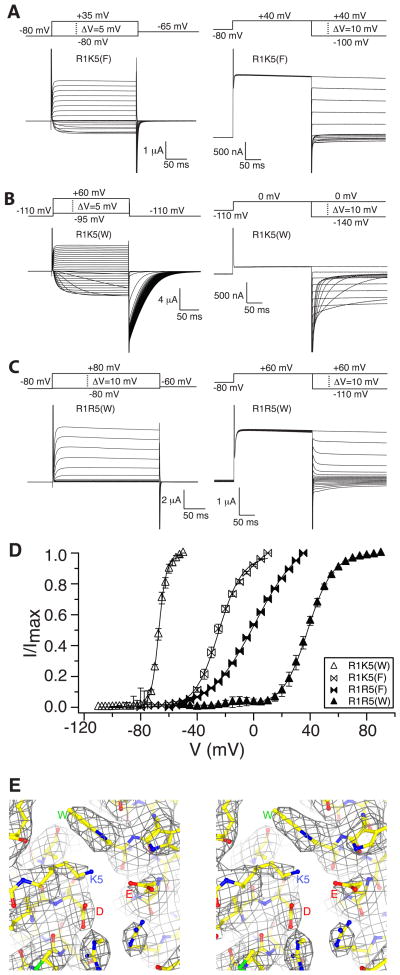
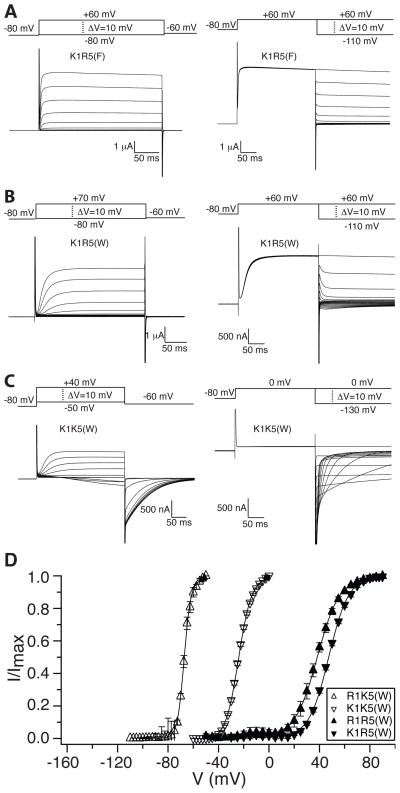
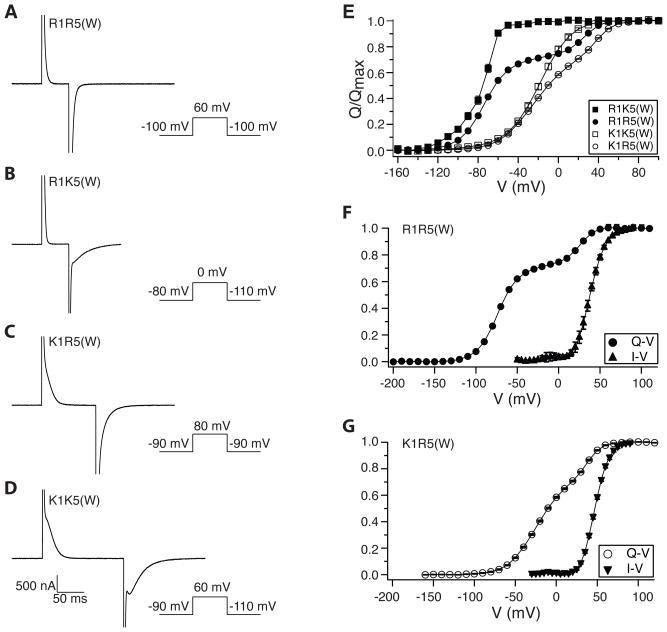
Voltage sensors regulate the conformations of voltage-dependent ion channels and enzymes. Their nearly switchlike response as a function of membrane voltage comes from the movement of positively charged amino acids, arginine or lysine, across the membrane field. We used mutations with natural and unnatural amino acids, electrophysiological recordings, and x-ray crystallography to identify a charge transfer center in voltage sensors that facilitates this movement. This center consists of a rigid cyclic "cap" and two negatively charged amino acids to interact with a positive charge. Specific mutations induce a preference for lysine relative to arginine. By placing lysine at specific locations, the voltage sensor can be stabilized in different conformations, which enables a dissection of voltage sensor movements and their relation to ion channel opening.


Figures

Fig. 1
Fig. 1. An occluded cation binding site is highly conserved among voltage-sensor containing proteins
(A) Ribbon representation of the transmembrane region of Kv2.1 paddle-Kv1.2 chimera channel tetramer (Kvchim, PDB ID 2R9R), viewed from the side, oriented with the extracellular solution above. The pore is colored blue; the voltage sensor paddle (S3b and S4) and the linker helix (S4–S5) between voltage sensor and the pore red; and S1, S2 and S3a grey. The voltage sensor closest to the viewer is removed for clarity. K+ ions in the selectivity filter are shown as green spheres. (B) Ribbon representation of the pore and S4–S5 linkers in the hypothetical closed conformation (C) from a model constructed from the Kvchim (PDB ID 2R9R) and KcsA (PDB ID 1K4C) structures and in the open conformation (O) from the crystal structure of Kvchim (PDB ID 2R9R). In the hypothetical closed state, based on the closed conformation of KcsA, the S4–S5 linker helices are pushed down to maintain their same contacts with the pore. (C) Stereoview of the voltage sensor and S4–S5 linker helix of the open conformation from Kvchim. Side chains of the positive charged residues on S4 (labeled as R0, R1, R2, R3, R4 and K5) and the negative charged residues forming ionizing hydrogen bonds (dashed black lines) with the positive charges, as well as those of the three residues (labeled as F, E and D) forming an occluded binding site in the voltage sensor are shown as sticks and colored according to atom types (yellow, carbon; blue, nitrogen; red, oxygen; green, phenylalanine). (D) Sequence alignment of the S4 segment of Kvchim (GI: 160877792) and Shaker Kv (GI: 13432103). The positive charged residues are colored blue. Numbers (0 to 5, equivalent to panel C) above the sequences are used to indicate the positive charges on S4 throughout the text. (E) Sequence alignment of Kvchim (GI: 160877792), Shaker Kv (GI: 13432103), human Nav1.1 (GI: 115583677), human Cav1.1 (GI: 110349767), human Hv1 (GI: 91992155) and ciona VSP (GI: 76253898). Only the segment of S2 and S3a forming the occluded binding site is included. The three highly conserved residues forming the site are highlighted: F, green and E and D, red. F corresponds to Phe233 in Kvchim.
Fig. 2
Fig. 2. A rigid cyclic side chain is important at the position of Phe233
(A) Voltage-dependent channel activation of the Phe233 mutants. On the left is a representative current trace of Shaker recorded with a voltage pulse protocol shown above. On the right voltage activation curves of Shaker wt and F→W/Y/T/E mutants are shown, in which the fraction of the maximum activatable current (I/Imax, mean ± s.e.m.) is plotted as a function of the depolarization voltage (I–V plot) and fitted with the two-state Boltzmann function (see methods, wt, n = 11; F→W, n = 9; F→Y, n = 7; F→T, n = 4; and F→E, n = 9). (B) Midpoint activation voltage (Vm) of Shaker wt and F→X mutants (X represents the other 19 natural amino acids). The mutants are grouped into 4 categories based on expressed current level (indicated by the bar color: black, high current level; green, medium current level; magenta: low current level) and the value of Vm (indicated by the bar height). Oocytes expressing the Lys or Arg mutants did not produce any Agitoxin2-sensitive current. The expressed current level of the Asp mutant was too low to generate a usable I-V plot. Vm of the Gly mutant was not determined as its I-V plot cannot be fitted with the two-state Boltzmann function. (C) Voltage-dependent channel activation of the Phe to cyclohexylalanine (Cha) mutant. The left side shows a representative current trace of the Cha mutant recorded with a voltage pulse protocol shown above. The right shows the voltage activation curves of Shaker wt and the Cha mutant. The curves are fitted with the two-state Boltzmann function (see methods, wt, n = 11; Cha, n = 15).
Fig. 3
Fig. 3. Effects of the Phe to Trp mutation depend on the amino acid at position 5
(A) (B) (C) Representative current traces of voltage-dependent channel opening (left) and closing (right) of R1K5(F) (i.e. Shaker wt), R1K5(W), and R1R5(W). The corresponding pulse protocols are shown above the traces. (D) The voltage activation curves of R1K5(F) (i.e. Shaker wt), R1K5(W), R1R5(F) and R1R5(W). Fraction of the maximal current (I/Imax, mean ± s.e.m.) is plotted as a function of the depolarization voltage and fitted with the two-state Boltzmann function [see methods, R1K5(F), n = 11; R1K5(W), n = 9; R1R5(F), n = 12; and R1R5(W), n = 5]. (E) Stereo representation of electron density (grey wire mesh, 2Fo-Fc, calculated from 50–2.9 Å using phases from the final model and contoured at 0.8 σ) for the occluded binding site in the crystal structure of the Kvchim F233W mutant [equivalent to R1K5(W)]. The protein is shown as sticks and colored according to atom types (yellow, carbon; blue, nitrogen and red, oxygen).
Fig. 4
Fig. 4. Lys at position 1 and 5 stabilize the voltage sensor in its closed and open conformation respectively in the presence of Trp
(A) (B) (C) Representative current traces of voltage-dependent channel opening (left) and closing (right) of K1R5(F), K1R5(W), and K1K5(W). The corresponding pulse protocols are shown above the traces. (D) The voltage activation curves of R1K5(W), K1K5(W), R1R5(W), and K1R5(W). Fraction of the maximal current (I/Imax, mean ± s.e.m.) is plotted as a function of the depolarization voltage and fitted with the two-state Boltzmann function [see methods, R1K5(W), n = 9; K1K5(W), n = 11; R1R5(W), n = 5; and K1R5(W), n = 7].
Fig. 5
Fig. 5. Voltage sensor movements assessed by gating currents
(A) (B) (C) (D) Representative transient current traces following voltage steps are shown for R1R5(W), R1K5(W), K1R5(W) and K1K5(W). Corresponding pulse protocols are shown next to the traces. Ionic currents are blocked using at least 50 μM Agitoxin2 and baselines were corrected by subtracting the Agitoxin2-insensitive current (see methods). (E) Q–V plots of the four mutants in panel A. Total gating charges, calculated by integrating the repolarization-induced transient currents over time and subtracting the linear capacitive component, were plotted as a function of the step voltage [see methods, R1R5(W), n = 11; R1K5(W), n = 13; K1R5(W), n = 24 and K1K5(W), n = 22]. (F) Q–V and I–V plots of the R1R5(W) channel. Note that I/Imax in the I–V plot does not represent the true open probability of the channel and same applies to panel G. (G) Q–V and I–V plots of the K1R5(W) channel.
Fig. 6
Fig. 6. State model of voltage sensor conformational change
(A) A simple model consists of five voltage sensor states (state 1 though 5) within each voltage sensor connected by four transitions prior to the final pore opening step. For each state, a different positive charged S4 residue (indicated by the number) is located in the occluded binding site (indicated by the surrounding circle). When all four voltage sensors are in state 5, the pore opens and ions conduct. The model assumes equal distribution of voltage-dependence over the four transitions, and a single forward and a single backward rate constant for the first three transitions. Below the model is a depiction of the energy as a function of the voltage sensor reaction coordinate in R1K5(W), K1R5(W) and K1K5(W) channels, illustrating the qualitative effect of Lys on energy well depth when bound in the occluded binding site with Trp. (B) The gating current time course generated from the above model are shown for R1K5(W) and R1R5(W) channels in association with a 100 mV to −120 mV voltage step. (C) (D) The Q–V and I–V plots of R1K5(W) and R1R5(W) channels generated from the model.

References

    1. Hille B. Ion Channels of Excitable Membranes. Sinauer Associates; Sunderland, MA: 2001.
    1. Okamura Y, Murata Y, Iwasaki H, Sasaki M. Tanpakushitsu Kakusan Koso. 2006 Jan;51:18. - PubMed
    1. Murata Y, Iwasaki H, Sasaki M, Inaba K, Okamura Y. Nature. 2005 Jun 30;435:1239. - PubMed
    1. Armstrong CM, Bezanilla F. J Gen Physiol. 1974 May;63:533. - PMC - PubMed
    1. Seoh SA, Sigg D, Papazian DM, Bezanilla F. Neuron. 1996 Jun;16:1159. - PubMed

Publication types

MeSH terms

Associated data