. 2010 Apr 2;328(5974):106-9.
doi: 10.1126/science.1183108.

Synchrony of thalamocortical inputs maximizes cortical reliability

Affiliations

Synchrony of thalamocortical inputs maximizes cortical reliability

Hsi-Ping Wang et al. Science. .

Abstract

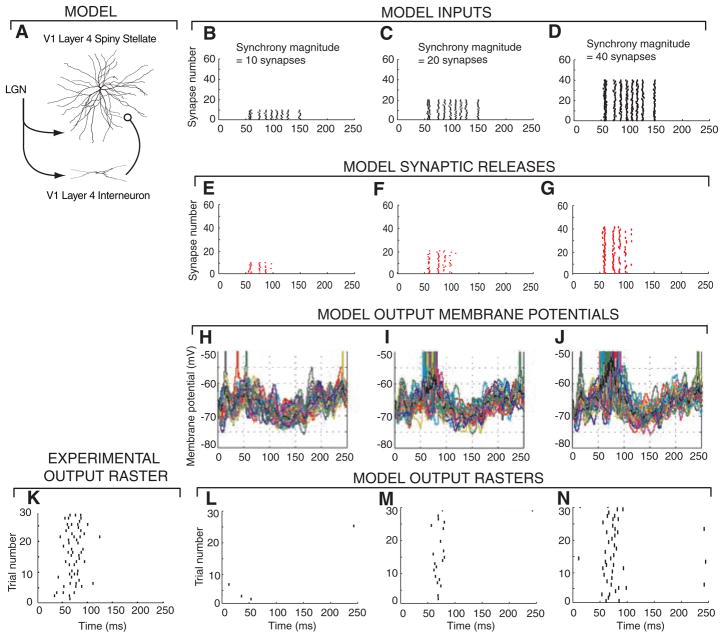
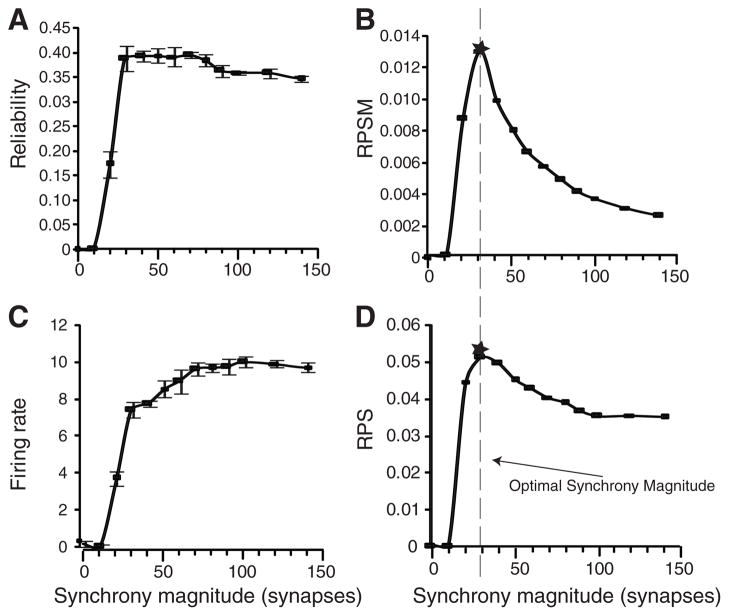
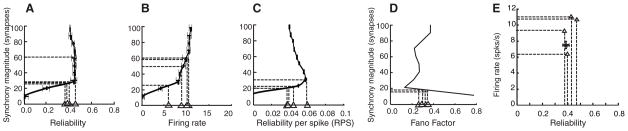
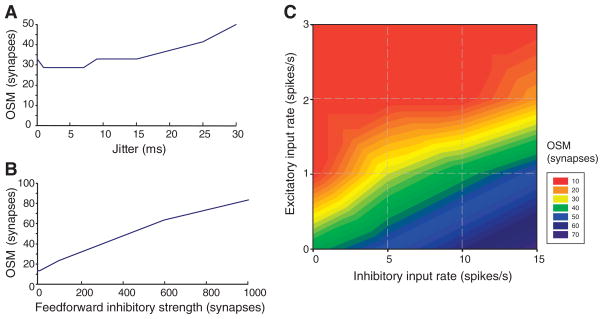
Thalamic inputs strongly drive neurons in the primary visual cortex, even though these neurons constitute only approximately 5% of the synapses on layer 4 spiny stellate simple cells. We modeled the feedforward excitatory and inhibitory inputs to these cells based on in vivo recordings in cats, and we found that the reliability of spike transmission increased steeply between 20 and 40 synchronous thalamic inputs in a time window of 5 milliseconds, when the reliability per spike was most energetically efficient. The optimal range of synchronous inputs was influenced by the balance of background excitation and inhibition in the cortex, which could gate the flow of information into the cortex. Ensuring reliable transmission by spike synchrony in small populations of neurons may be a general principle of cortical function.


Figures

Fig. 1
Fig. 1
Varying the synchrony of input synapses affects output reliability and firing rates. (A) Morphology of a reconstructed V1 layer 4 spiny stellate cell that was modeled with 748 compartments, thalamocortical (TC) synapses with a release probability of P = 0.2 and short-term plasticity (13, 14), and a feedforward inhibitory interneuron that receives input from LGN and projects to the spiny stellate cell. (B to D) Rastergrams of 60 thalamocortical synaptic inputs into the model cell for one trial. An input spike train obtained from in vivo LGN recordings (21) (referred to as event times) was repeated on a number of input synapses (SM). The input events were time jittered on average by 1 ms and had 1 out of 10 spikes randomly deleted. (E to G) Synaptic release rastergram for inputs (B to D). (H to J) Superimposed spiny stellate membrane potentials from 30 trials. (K) Cortical cell output spike trains from experimental in vivo recordings (21). (L to N) Rastergrams of outputs from 30 trials of inputs based on different LGN spike trains from the in vivo data.
Fig. 2
Fig. 2
Average spike-time reliability, firing rate, and efficiency measures as a function of synchrony magnitude for inputs as described in Fig. 1. Standard deviation bars plotted using data from 10 sets of simulations with 30 independent trials each. (A) Output spike reliability. (B) RPSM has a peak at a synapse synchrony magnitude of 30 (vertical dashed line). (C) Firing rate responses. (D) RPS efficiency (reliability/firing rate) also peaked at 30 synchronous synapses.
Fig. 3
Fig. 3
Predicted input synchrony ranges for in vivo recordings. Graphs from Fig. 2 were inverted to make synchrony magnitude the dependent variable. In each plot, four triangles are positioned along the x axis (input value), corresponding to in vivo experimentally measured values from four separate animals (21), and the inferred output synchrony magnitude is shown as a horizontal dashed line from the first intersection on each curve. Predictions were made based on (A) reliability, (B) firing rates, (C) RPS, and (D) FF (taken from fig. S4C). (E) The predicted firing rate and reliability at SM = 30 (solid circle with error bars indicating SD) is plotted along with the measured values from the four sets of recordings (triangles). Despite the small sample of cells with enough trials, the estimated reliabilities cluster around 0.4.
Fig. 4
Fig. 4
Effect of input jitter, inhibitory inter-neuron strength, and the balance of inhibitory and excitatory background inputs on the predicted OSM. (A) The jitter of the input event signals was varied from 0 to 30 ms. The default used in Figs. 1 to 3 used jitter = 1 ms. (B) The number of synapses from the feedforward inhibitory inter-neurons was varied from 0 to 1000 synapses. The default used in Figs. 1 to 3 was 200 synapses. (C) The Poisson-distributed presynaptic spike trains for the 4500 excitatory (glutamate) and 1000 inhibitory (γ-aminobutyric acid) intracortical synapses were covaried from 1 to 3 spikes/s excitatory background inputs and 1 to 15 spikes/s inhibitory background inputs. The default in Figs. 1 to 3 was 1 excitatory spike/s and 5 inhibitory spikes/s.

Similar articles

Cited by

References

    1. Salinas E, Sejnowski TJ. Nat Rev Neurosci. 2001;2:539. - PMC - PubMed
    1. Reinagel P, Reid RC. J Neurosci. 2000;20:5392. - PMC - PubMed
    1. Bruno RM, Sakmann B. Science. 2006;312:1622. - PubMed
    1. Dan Y, Alonso JM, Usrey WM, Reid RC. Nat Neurosci. 1998;1:501. - PubMed
    1. Reich DS, Mechler F, Purpura KP, Victor JD. J Neurosci. 2000;20:1964. - PMC - PubMed

Publication types