. 2010 May 14;106(9):1459-67.
doi: 10.1161/CIRCRESAHA.110.217513. Epub 2010 Apr 1.

Deep mRNA sequencing for in vivo functional analysis of cardiac transcriptional regulators: application to Galphaq

Affiliations

Deep mRNA sequencing for in vivo functional analysis of cardiac transcriptional regulators: application to Galphaq

Scot J Matkovich et al. Circ Res. .

Abstract

Rationale: Transcriptional profiling can detect subclinical heart disease and provide insight into disease etiology and functional status. Current microarray-based methods are expensive and subject to artifact.

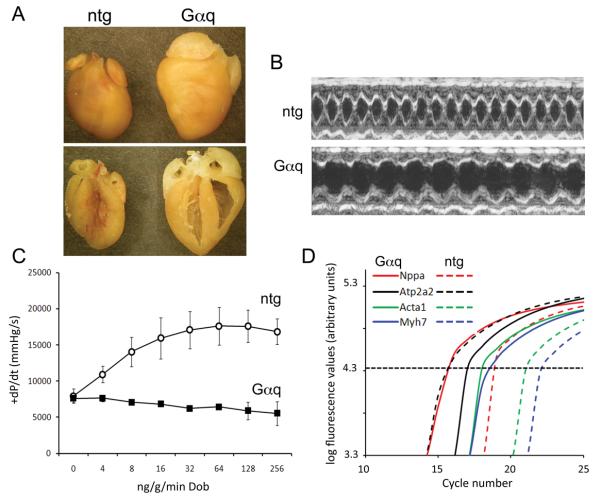
Objective: To develop RNA sequencing methodologies using next generation massively parallel platforms for high throughput comprehensive analysis of individual mouse cardiac transcriptomes. To compare the results of sequencing- and array-based transcriptional profiling in the well-characterized Galphaq transgenic mouse hypertrophy/cardiomyopathy model.

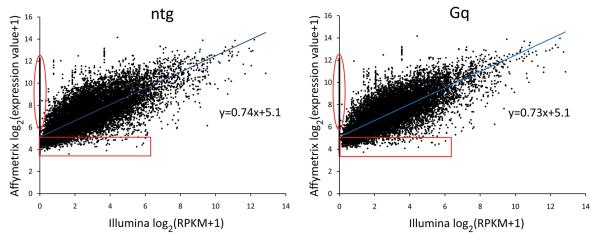
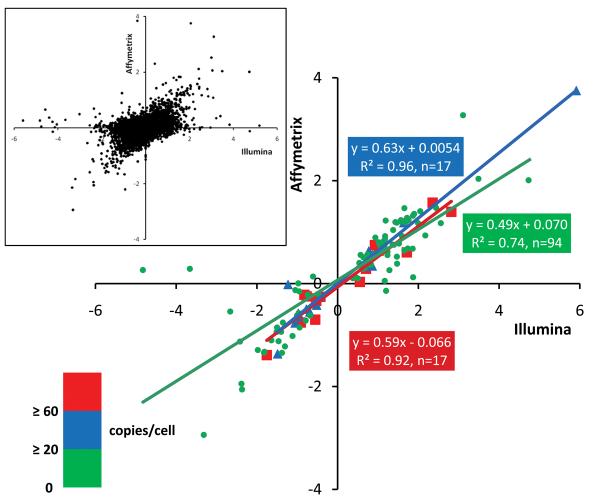
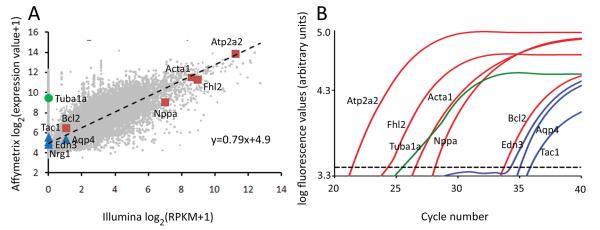
Methods and results: The techniques for preparation of individually bar-coded mouse heart RNA libraries for Illumina Genome Analyzer II resequencing are described. RNA sequencing showed that 234 high-abundance transcripts (>60 copies/cell) comprised 55% of total cardiac mRNA. Parallel transcriptional profiling of Galphaq transgenic and nontransgenic hearts by Illumina RNA sequencing and Affymetrix Mouse Gene 1.0 ST arrays revealed superior dynamic range for mRNA expression and enhanced specificity for reporting low-abundance transcripts by RNA sequencing. Differential mRNA expression in Galphaq and nontransgenic hearts correlated well between microarrays and RNA sequencing for highly abundant transcripts. RNA sequencing was superior to arrays for accurately quantifying lower-abundance genes, which represented the majority of the regulated genes in the Galphaq transgenic model.

Conclusions: RNA sequencing is rapid, accurate, and sensitive for identifying both abundant and rare cardiac transcripts, and has significant advantages in time- and cost-efficiencies over microarray analysis.


Figures

Figure 1
Figure 1. Phenotype of the adult Gαq-40 transgenic heart
(A) Formalin-fixed intact hearts (upper panel) and four-chamber views (lower panel). (B) Representative M-mode echocardiograms. (C) Response to graded infusion of dobutamine during cardiac catheterization (mean ± SEM, n=3 each genotype). (D) Representative RT-qPCR fluorescence curves for ntg and Gαq cardiac gene expression (dotted line indicates Ct).
Figure 2
Figure 2. Gene ontology (GO) analysis of highly expressed genes in nontransgenic mouse heart
The 234 highest-expressing genes in nontransgenic mouse hearts (≥60 copies per cell) were classified into 15 GO categories using BiNGO 50. Size of the pie slice corresponds to the number of matches to a given GO category (shown at the edge of each slice). A total of 360 matches were made to the 15 categories shown. Classification of each gene is given in Supplemental Table III.
Figure 3
Figure 3. Correspondence of gene expression determined by RNA sequencing vs microarray, for individual hearts
Gene expression determined by RNA sequencing (Illumina) is plotted against gene expression determined by microarrays (Affymetrix). Values shown are log2(RPKM+1) for RNA sequencing (x-axis) and log2(Affymetrix signal units+1) for microarrays. A value of 1 was added to both RPKM and Affymetrix signal units to avoid taking the log of 0. Red circles highlight genes reported to be expressed by microarrays, but not by RNA sequencing. Red boxes show genes expressed below a typical cutoff level for microarray analysis. One nontransgenic heart and one Gq heart are shown; plots are representative of those for all 8 hearts (shown in Supplemental Figure I).
Figure 4
Figure 4. Fold-changes in gene expression determined by RNA sequencing vs microarray, in Gq-overexpressing compared to normal hearts
Fold-change in gene expression determined by RNA sequencing (Illumina) is plotted against fold-change in gene expression determined by microarrays (Affymetrix), using a log2 scale, for the 125 significantly regulated genes defined in Table 1. Red squares denote genes expressed at or above 60 copies/cell in nontransgenic hearts, blue triangles denote genes expressed between 20-60 copies/cell, and green circles denote genes expressed at or less than 20 copies/cell. Inset: comparison of fold-changes in all genes detected using RNA sequencing and microarrays, regardless of significance.
Figure 5
Figure 5. Comparison of gene expression by microarray, RNA sequencing and RT-qPCR
(A) Gene expression in nontransgenic hearts, determined by RNA sequencing, plotted against gene expression determined by microarrays. Values shown are log2(RPKM+1) for RNA sequencing (x-axis) and log2(Affymetrix signal units+1) for microarrays. Light gray, all expressed genes with regression line as in Figure 3. Red squares, genes regulated by both arrays and sequencing; blue triangles, genes regulated on arrays but poorly detected by sequencing; green circle, highly expressed on arrays but not detected by sequencing. (B) Representative TaqMan qPCR traces for genes shown in (A). Dotted line = fluorescence threshold for Ct determination.
Figure 6
Figure 6. Signaling networks of Gαq-regulated transcripts
Ingenuity Pathways Analysis software (http://www.ingenuity.com) was used to depict potential signaling pathways between (A) high-abundance and (B) low-abundance, Gαq-regulated gene products. Lines with arrowheads, molecule acts on a target; lines without arrowheads, binding only. Solid lines, direct interaction; dotted lines, indirect interaction. Blue background, high-abundance genes; green background, low-abundance genes; white background, member of signaling pathway but not regulated in Gαq hearts.

Similar articles

Cited by

References

    1. Dorn GW, II, Robbins J, Sugden PH. Phenotyping hypertrophy - eschew obfuscation. Circ Res. 2003;92:1171–1175. - PubMed
    1. Dorn GW., II The fuzzy logic of physiological cardiac hypertrophy. Hypertension. 2007;49:962–970. - PubMed
    1. Dorn GW, II, Matkovich SJ. Put your chips on transcriptomics. Circulation. 2008;118:216–218. - PubMed
    1. D'Angelo DD, Sakata Y, Lorenz JN, Boivin GP, Walsh RA, Liggett SB, Dorn GW., II Transgenic Gαq overexpression induces cardiac contractile failure in mice. Proc Natl Acad Sci USA. 1997;94:8121–8126. - PMC - PubMed
    1. Dorn GW, II, Tepe NM, Lorenz JN, Koch WJ, Liggett SB. Low- and high-level transgenic expression of β2-adrenergic receptors differentially affect cardiac hypertrophy and function in Gαq-overexpressing mice. Proc Natl Acad Sci USA. 1999;96:6400–6405. - PMC - PubMed

Publication types

Substances