. 2010 Jun;21(6):1003-13.
doi: 10.1681/ASN.2009070690. Epub 2010 Apr 1.

ATF3-mediated epigenetic regulation protects against acute kidney injury

Affiliations

ATF3-mediated epigenetic regulation protects against acute kidney injury

Hsiao-Fen Li et al. J Am Soc Nephrol. 2010 Jun.

Abstract

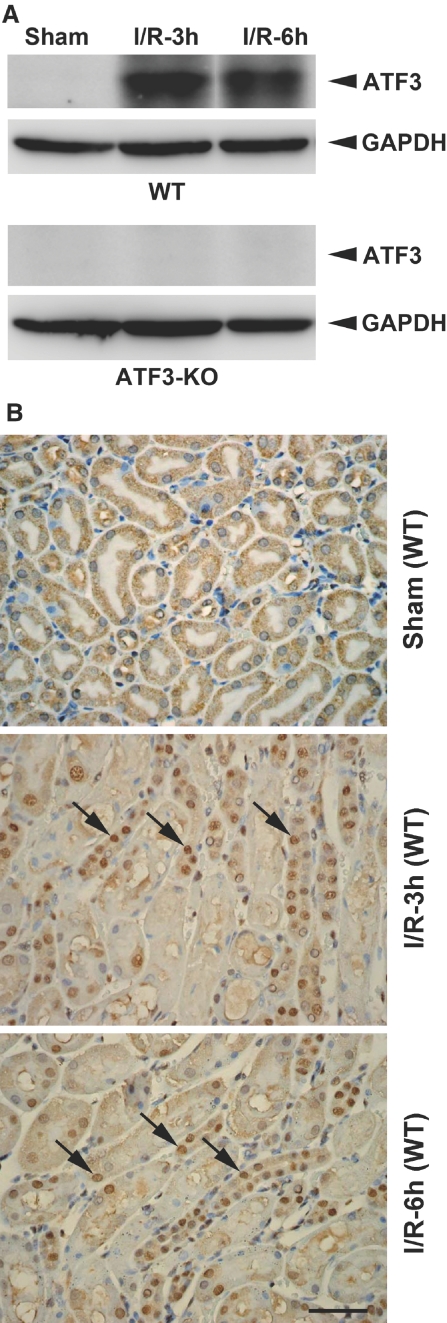
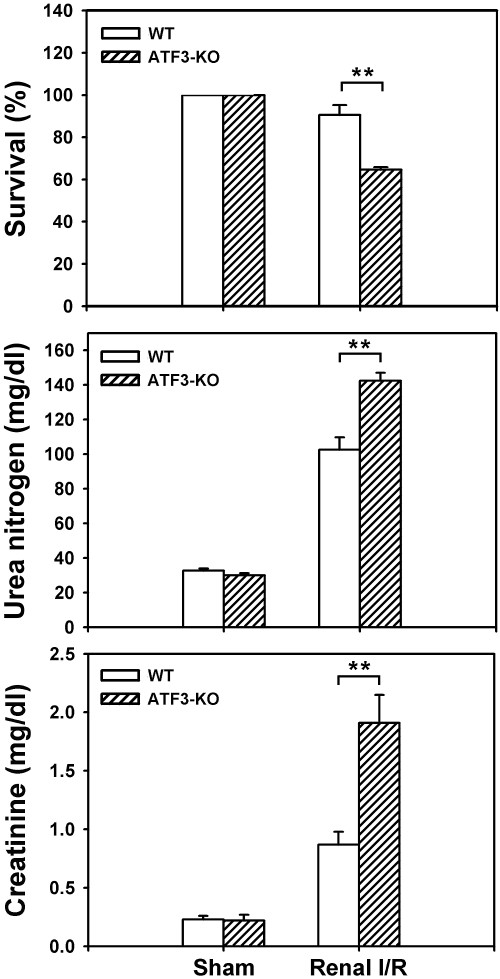
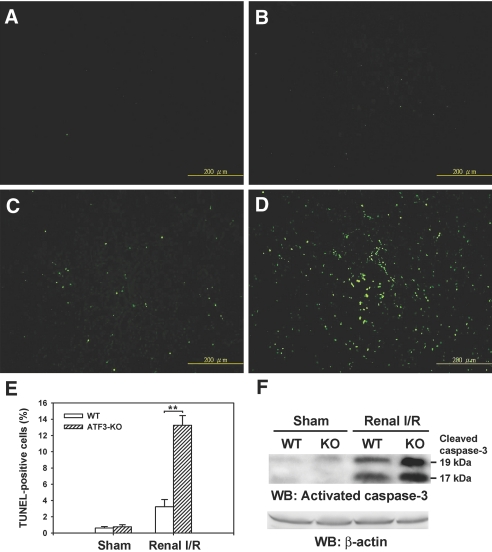
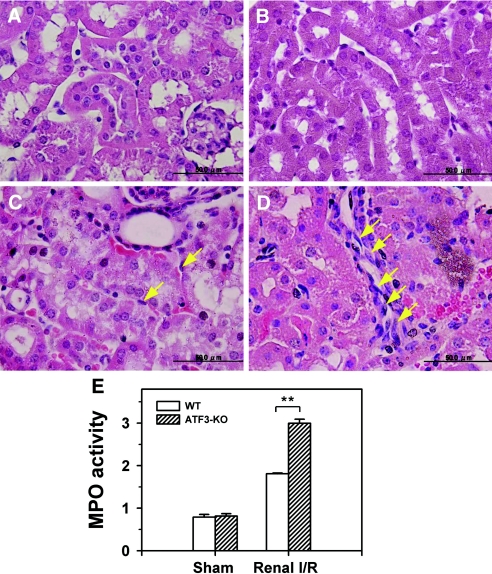
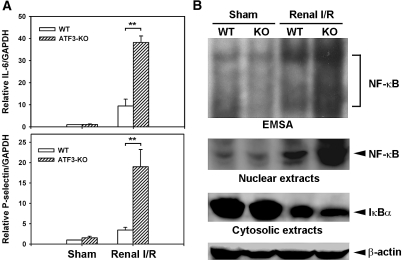
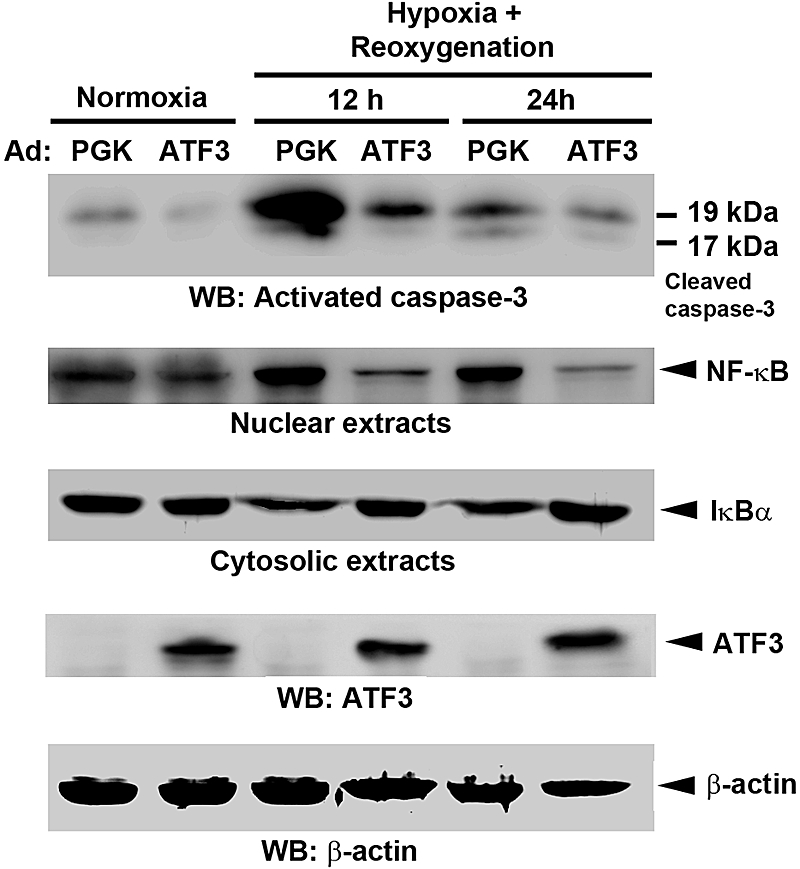
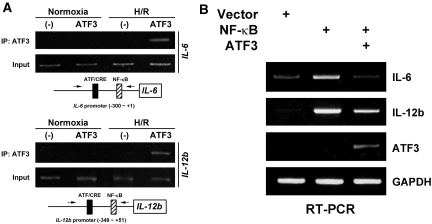
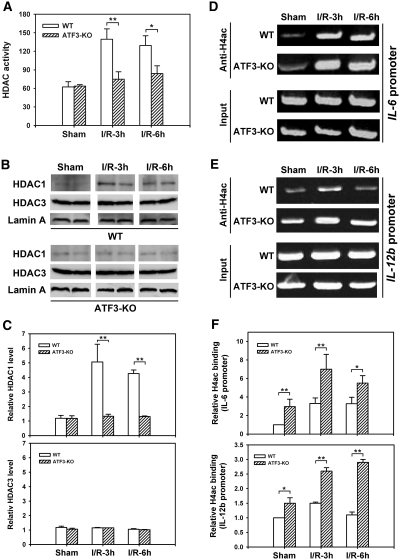
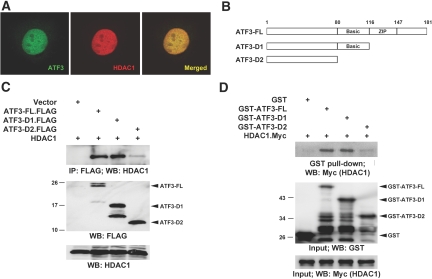
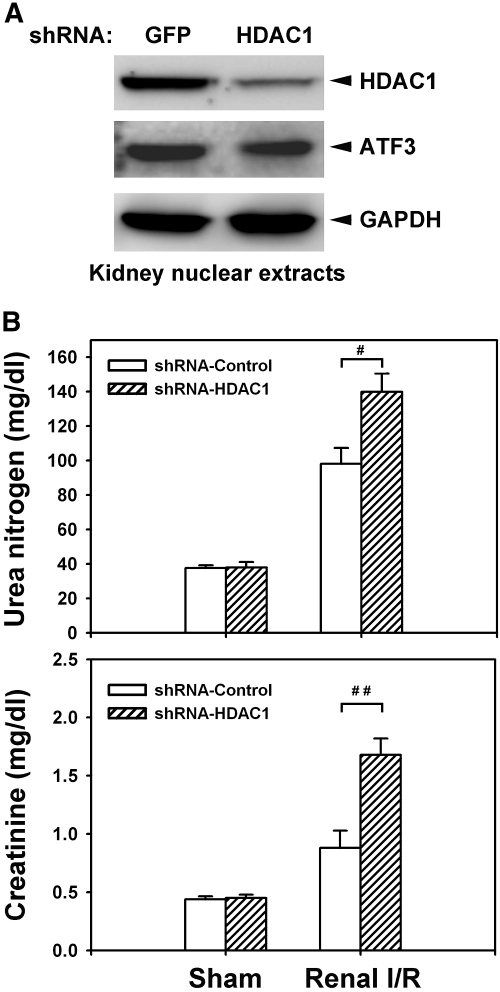
A variety of stress stimuli, including ischemia-reperfusion (I/R) injury, induce the transcriptional repressor ATF3 in the kidney. The functional consequences of this upregulation in ATF3 after renal I/R injury are not well understood. Here, we found that ATF3-deficient mice had higher renal I/R-induced mortality, kidney dysfunction, inflammation (number of infiltrating neutrophils, myeloperoxidase activity, and induction of IL-6 and P-selectin), and apoptosis compared with wild-type mice. Furthermore, gene transfer of ATF3 to the kidney rescued the renal I/R-induced injuries in the ATF3-deficient mice. Molecular and biochemical analysis revealed that ATF3 interacted directly with histone deacetylase 1 (HDAC1) and recruited HDAC1 into the ATF/NF-kappaB sites in the IL-6 and IL-12b gene promoters. The ATF3-associated HDAC1 deacetylated histones, which resulted in the condensation of chromatin structure, interference of NF-kappaB binding, and inhibition of inflammatory gene transcription after I/R injury. Taken together, these data demonstrate epigenetic regulation mediated by the stress-inducible gene ATF3 after renal I/R injury and suggest potential targeted approaches for acute kidney injury.


Figures

Figure 1.
Figure 1.
Renal ATF3 is induced upon I/R injury in WT or ATF3-KO mice. (A) Western blot analysis of ATF3 protein in kidney homogenates from I/R-treated WT and ATF3-KO mice. (B) Localization of ATF3 in the kidney tissue of sham-operated or I/R-treated WT mice by immunohistochemical staining. Arrows indicate ATF3 nuclear staining of tubular epithelial cells. h, hours. Bar = 50 μm.
Figure 2.
Figure 2.
I/R decreases overall survival and kidney function in WT and ATF3-KO mice. Age-matched WT and ATF3-KO mice underwent sham operation or I/R and then were monitored for survival 2 days later (top). Survival rates are means ± SEM from three independent experiments (n = 8 animals in each group). Serum levels of urea nitrogen (middle) and creatinine (bottom) were measured 24 hours after reperfusion or sham surgery. Data are mean ± SEM (n = 6 mice in each group). **P < 0.01, WT versus ATF3-KO.
Figure 3.
Figure 3.
I/R increases renal tubular epithelial cell apoptosis in WT and ATF3-KO mice. WT (A and C) and ATF3-KO (B and D) mice underwent sham operation (A and B) or I/R injury (renal ischemia for 45 minutes, then 18 hours of reperfusion; C and D). TUNEL staining of representative kidney sections from each experimental group is shown. Bar = 200 μm. (E) Quantitative analysis of TUNEL-positive renal epithelial nuclei per total nuclei in WT and ATF3-KO mice after sham operation or I/R injury (n = 5 mice per group). (F) Active caspase-3 protein expression. Kidney lysates from WT and ATF3-KO mice subjected to sham operation and renal I/R were probed with specific antibody against the cleaved, active form of caspase-3. Experiments were performed twice with similar results. WB, Western blot. **P < 0.01, WT versus ATF3-KO.
Figure 4.
Figure 4.
I/R increases polymorphonuclear leukocyte infiltration and myeloperoxidase (MPO) activity in WT and ATF3-KO mice. Sham-operated (A and B) and I/R-injured (C and D) WT (A and C) and ATF3-KO (B and D) mice. A significant number of infiltrating polymorphonuclear leukocytes (yellow arrows) accumulated in the ATF3-KO kidney (D), with fewer in the WT (C) kidney. (E) MPO activity in renal tissue samples obtained from WT and ATF3-KO mice after sham operation or I/R injury. MPO activity is expressed as ΔOD460/min per milligram of protein. **P < 0.01, WT versus ATF3-KO. Figures are representative of three experiments performed on different days (n = 5 mice in each group). Bar = 50 μm.
Figure 5.
Figure 5.
I/R injury increases the expression of IL-6 and P-selectin or NF-κB DNA-binding activity in WT and ATF3-KO renal tissues. (A) Quantitative RT-PCR analysis of IL-6 and P-selectin from renal cDNA derived from mice subjected to sham surgery or renal I/R injury (3 hours after ischemia). Expression was normalized to that of GAPDH. Experiments were performed twice with similar results (n = 5 mice in each group). **P < 0.01, WT versus ATF3-KO. (B) NF-κB nuclear translocation, activation, and IκB degradation. (Top) EMSA results of NF-κB expression in renal nuclear extracts of WT and ATF3-KO mice subjected to sham operation or I/R injury. (Bottom) Nuclear or cytosolic extracts were probed with anti-NF-κB or anti-IκB antibody, respectively, to quantify protein levels in these subcellular compartments. Anti-β-actin served as a loading control.
Figure 6.
Figure 6.
Adenovirus-mediated expression of ATF3 decreases apoptotic and inflammatory signaling. Renal proximal tubule epithelial (NRK-52E) cells were transduced with the control adenovirus (Ad:PGK) or Ad:ATF3 (multiplicity of infection = 30) for 24 hours before being subjected to normoxia or hypoxia (24 hours), and then reoxygenation for 12 or 24 hours. Cell lysates were probed with specific antibody against the cleaved, active form of caspase-3, NF-κB (nuclear extracts), and IκBα (cytosolic extracts). The protein expression of ATF3 was confirmed by Western blot (WB) analysis. Note that induction of endogenous ATF3 protein under hypoxia/reoxygenation can be detected after a longer exposure (Supplemental Figure 9). Anti-β-actin served as a loading control. Experiments were performed twice with similar results.
Figure 7.
Figure 7.
Recruitment of ATF3 to the proximal promoter region of IL-6 and IL-12b suppresses the expression of these inflammatory genes. (A) ChIP assay. NRK-52E cells were transfected with an empty vector as a negative control (−) or the expression plasmid encoding ATF3 (FLAG-tagged) for 24 hours before being subjected to normoxia or hypoxia (24 hours), and then reoxygenation for 6 hours (H/R). Cell lysates were cross-linked with formaldehyde, and ChIP assay involved use of anti-FLAG antibody (for ATF3). Immunoprecipitated (IP) DNA was amplified by PCR for the proximal promoter region of IL-6 (top) or IL-12b (bottom). Arrows indicate the PCR primers used for ChIP assays. (B) ATF3 inhibits NF-κB-induced IL-6 or IL-12b expression. NRK-52E cells were transfected with the empty expression plasmid (Vector), NF-κB (two plasmids encoding for the p50 or p65 subunit), or NF-κB together with the ATF3 (FLAG epitope-tagged) expression plasmid. Results are from RT-PCR analysis of the expression of NF-κB-induced IL-6 or IL-12b relative to that of GAPDH 2 days after transfection. Note that the endogenous ATF3 expression is not visible because the primers used for RT-PCR analysis are specific for only FLAG-tagged ATF3, not endogenous ATF3. Experiments were performed twice with similar results.
Figure 8.
Figure 8.
I/R injury increases nuclear histone deacetylase activity, HDAC1 or HDAC3 nuclear localization, and H4 acetylation on the IL-6 or IL-12b gene promoter in WT and ATF3-KO kidneys. Kidney nuclear extracts derived from sham-operated or I/R-treated WT or ATF3-KO mice were used to determine total HDAC activity (A), HDAC1 or HDAC3 protein levels by Western blot analysis (B), or dynamics of H4 acetylation (H4ac) on the IL-6 or IL-12b promoter by ChIP assay (D and E), as described in Concise Methods. (C) Histographic quantification of nuclear HDAC1 or HDAC3 protein levels in respective groups shown in B (quantified by densitometric scanning and normalized to nuclear lamin A protein level). (F) Quantification of anti-H4ac ChIP analysis in D or E. For semiquantitative analysis, PCR reactions involved genomic DNA obtained from each sample before immunoprecipitation, noted as “Input.” The relative values for anti-H4ac ChIP assays were quantified by densitometric scanning and normalized to the values of “input.” The value from the WT sham animal group was set to 1. Data are means ± SEM (n = 3 in each group) in A or F. Experiments were performed twice with similar results. h, hours. *P < 0.05 and **P < 0.01, WT versus ATF3-KO.
Figure 9.
Figure 9.
Nuclear colocalization and complex formation of ATF3 with HDAC1. (A) Colocalization of ATF3 with HDAC1 in the cell nuclei. HEK-293T cells cotransfected with the expression plasmids for ATF3 (FLAG-tagged) and HDAC1 (Myc-tagged) were stained with anti-FLAG monoclonal antibody (for ATF3; green), and anti-Myc polyclonal antibody (HDAC1; red), then were examined by immunofluorescence confocal microscopy. Overlay of the two images is shown (merged), with colocalization appearing as yellow. (B) Diagram of ATF3 full-length (FL) and two C-terminal deletion mutants used for binding assay. (C and D) Biochemical interaction between ATF3 and HDAC1 in vivo and in vitro. The HDAC1 expression plasmid was transfected alone or in combination with the expression plasmids encoding FLAG-tagged ATF3-FL or two deletion D1 and D2 proteins in HEK-293T cells. Two days later, cell lysates underwent immunoprecipitation (intraperitoneally) and Western blot (WB) analysis with antibodies as indicated to determine the protein-protein interactions (C). ATF3 (FL, D1, and D2) or HDAC1 was expressed as GST fusion proteins or C-terminally tagged with Myc (HDAC1.Myc) by in vitro translation, respectively. Binding of these proteins in vitro was assayed by GST pull-down assay (D). Input was 10% of total.
Figure 10.
Figure 10.
HDAC1 knockdown increases I/R-induced renal dysfunction. (A) Lentivirus-mediated short-hairpin RNA (shRNA) knockdown of HDAC1 in the kidney. The recombinant lentivirus carrying shRNA for HDAC1 or green fluorescent protein (GFP) as controls (1 × 10⁹ viral particles per animal) was perfused into the WT kidney through renal artery. Two weeks after transduction, the nuclear extracts derived from the kidney transduced with lentivirus for GFP or HDAC1 were probed with anti-HDAC1, anti-ATF3, or anti-GAPDH antibody to validate the efficiency and specificity of the knockdown. (B) HDAC1 is required for limiting the I/R-induced renal dysfunction. Control (GFP or empty virus) or HDAC1-KO mice underwent sham operation or I/R injury for 8 hours. Blood urea nitrogen and creatinine levels, indicators for renal function, were measured. Data are means ± SEM (n = 5 in each group). #P < 0.05 and ##P < 0.01, shRNA-GFP versus shRNA-HDAC1 knockdown.

References

    1. Schiffl H, Lang SM, Fischer R: Daily hemodialysis and the outcome of acute renal failure. N Engl J Med 346: 305–310, 2002. - PubMed
    1. Star RA: Treatment of acute renal failure. Kidney Int 54: 1817–1831, 1998. - PubMed
    1. Daemen MA, de Vries B, Buurman WA: Apoptosis and inflammation in renal reperfusion injury. Transplantation 73: 1693–1700, 2002. - PubMed
    1. Kouzarides T: Acetylation: A regulatory modification to rival phosphorylation? EMBO J 19: 1176–1179, 2000. - PMC - PubMed
    1. Cheung P, Allis CD, Sassone-Corsi P: Signaling to chromatin through histone modifications. Cell 103: 263–271, 2000. - PubMed

Publication types

MeSH terms