. 2010 Apr 1;24(7):683-95.
doi: 10.1101/gad.560310.

The nuclear receptor tailless induces long-term neural stem cell expansion and brain tumor initiation

Affiliations

The nuclear receptor tailless induces long-term neural stem cell expansion and brain tumor initiation

Hai-Kun Liu et al. Genes Dev. .

Abstract

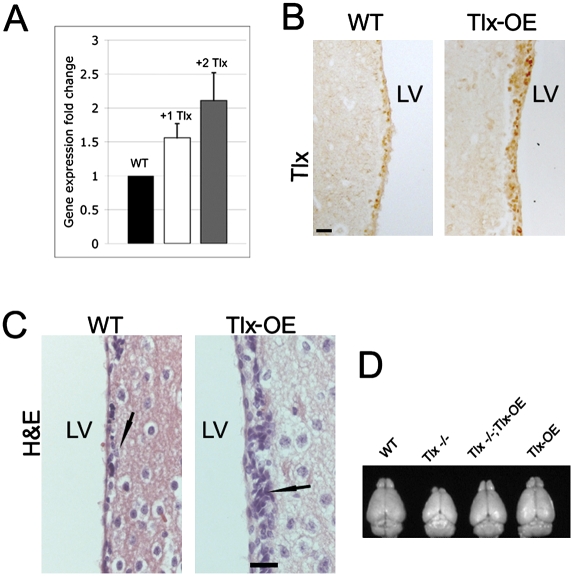
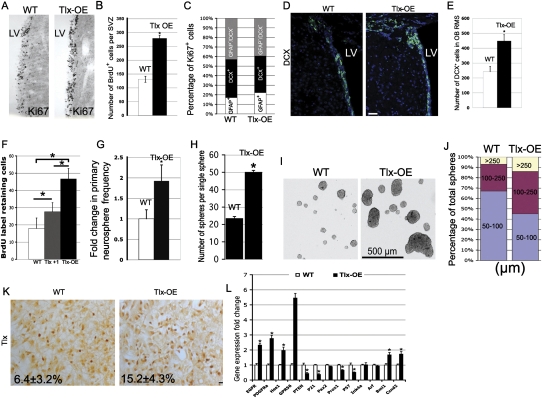
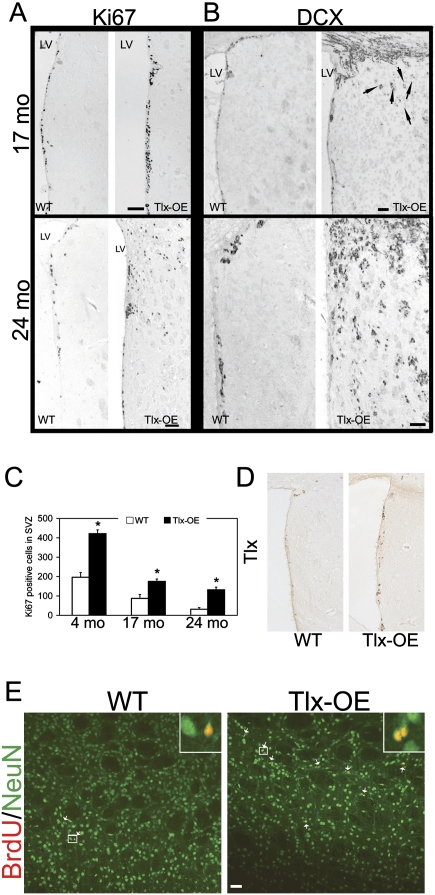
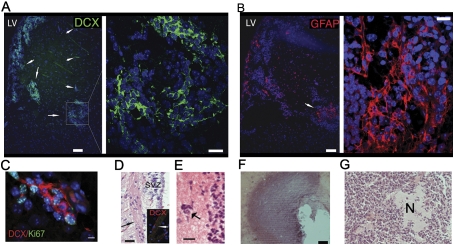
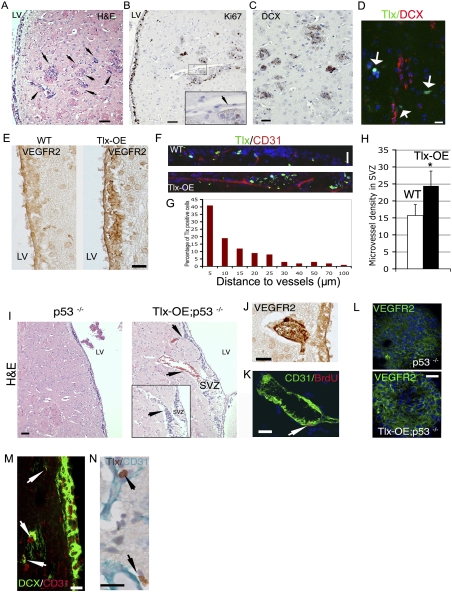
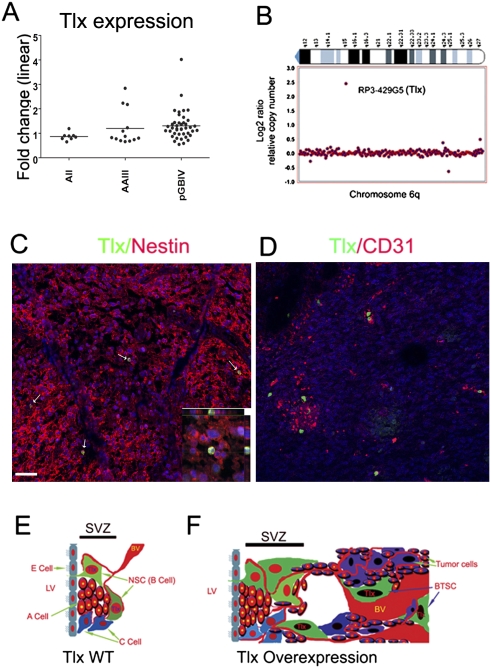
Malignant gliomas are the most common primary brain tumors, and are associated with frequent resistance to therapy as well as poor prognosis. Here we demonstrate that the nuclear receptor tailless (Tlx), which in the adult is expressed exclusively in astrocyte-like B cells of the subventricular zone, acts as a key regulator of neural stem cell (NSC) expansion and brain tumor initiation from NSCs. Overexpression of Tlx antagonizes age-dependent exhaustion of NSCs in mice and leads to migration of stem/progenitor cells from their natural niche. The increase of NSCs persists with age, and leads to efficient production of newborn neurons in aged brain tissues. These cells initiate the development of glioma-like lesions and gliomas. Glioma development is accelerated upon loss of the tumor suppressor p53. Tlx-induced NSC expansion and gliomagenesis are associated with increased angiogenesis, which allows for the migration and maintenance of brain tumor stem cells in the perivascular niche. We also demonstrate that Tlx transcripts are overexpressed in human primary glioblastomas in which Tlx expression is restricted to a subpopulation of nestin-positive perivascular tumor cells. Our study clearly demonstrates how NSCs contribute to brain tumorgenesis driven by a stem cell-specific transcription factor, thus providing novel insights into the histogenesis and molecular pathogenesis of primary brain tumors.


Figures

Figure 1.
Figure 1.
Characterization of Tlx-OE mice. (A) Quantitative PCR analysis of Tlx mRNA in microdissected SVZ cells of wild-type and transgenic mice with one or two additional Tlx gene copies. Note that expression of Tlx mRNA is correlated with the copy number of the Tlx gene (n = 3, mean ± standard deviation [SD]). (B) The adult SVZ of Tlx-OE mice (+2 copies of Tlx transgene) and wild-type controls were stained by Tlx antibody. Note more Tlx-expressing cells and higher intensity of Tlx staining in the SVZ of Tlx-OE mice. Bar, 20 μm, if not otherwise indicated. (C) Hematoxylin and eosin (H&E) staining of coronal sections from control and Tlx-OE mice. Note a higher cell density in the SVZ of Tlx-OE mice (arrow). (D) Brains isolated from adult age-matched wild-type, Tlx−/−, Tlx−/−;Tlx-OE, and Tlx-OE mice. Note that Tlx overexpression rescues the reduced brain size of Tlx−/− mice.
Figure 2.
Figure 2.
Tlx overexpression leads to expansion of NSCs in vivo and in vitro. (A) Coronal brain sections of the SVZ were stained with a Ki67 antibody. Note that there are more Ki67-positive cells in the SVZ of Tlx-OE mice as compared with wild-type (WT) mice. Tlx-OE mice in this and all other figures refer to the Tlx +2 copy line. (B) Mice were sacrificed 2 h after BrdU injection, and 50-μm coronal sections were chosen for BrdU staining. BrdU-positive cells were counted and the results are shown as number of BrdU-positive cells per SVZ per section (n = 5, P < 0.01, mean ± standard deviation [SD]). (C) Confocal optical sections of coronal sections of the mouse SVZ immunostained for GFAP together with Ki67 or DCX and Ki67. Numbers of double-positive cells were counted and are presented as percentage of total Ki67-positive cells (five sections were used from each mouse, n = 3). (D) Confocal optical sections of coronal sections of the mouse SVZ immunostained for DCX. Note that more DCX-positive cells were found in the SVZ of Tlx-OE mice. (E) DCX-positive cells were counted in the RMS of the OB. Note a significant increase of DCX-positive cells in Tlx-OE mice (n = 4, P < 0.01, mean ± standard deviation [SD]). (F) Number of BrdU LRCs in the adult SVZ. Mice received BrdU continuously in the drinking water for 1 wk, followed by a 3-wk survival period. Fifty-micron coronal sections were stained with BrdU, and BrdU-positive cells were counted as described above (n = 4, P < 0.05, mean ± standard deviation [SD]). (G) Fold change of primary neurosphere frequency. Neurosphere cultures were prepared as described in the Materials and Methods, and the number of primary neurospheres was determined (n = 3, P < 0.05, mean ± standard deviation [SD]). (H) Indvidual primary neurospheres were dissociated and plated into neurosphere culture medium (one sphere per well), and the number of secondary neurospheres were counted and are presented as number of spheres per single sphere (n = 3, P < 0.05, mean ± standard deviation [SD]). (I) The size of primary neurospheres derived from the SVZ of Tlx-OE mice is bigger than in wild-type (WT) mice. (J) Percentage of neurospheres with different sizes among the total number of neurospheres. Neurospheres were categorized according to their diameter, and the percentage of different categories (50–100 μm, 100–250 μm, and >250 μm) among the total populations was quantified (at least 200 neurospheres were measured for each mouse, n = 3). (K) Tlx antibody staining of neurospheres. Note that more Tlx-expressing cells are found in neuropheres derived from Tlx-OE mice (n = 3, P < 0.05, mean ± standard deviation [SD]). (L) Quantitative PCR analysis of EGFR, PDGFRα, HES1, GPR56, PTEN, p21 (Waf1), Pax2, Prox1, P57, Ink4a, Arf, Bmi1, and Ccnd2 mRNA expression in microdissected SVZ cells of the adult SVZ of wild-type and Tlx-OE mice (n = 5, P < 0.05, mean ± standard deviation [SD]).
Figure 3.
Figure 3.
Tlx overexpression-induced NSC expansion is not a transient effect. (A) Coronal sections from aged animals as indicated stained with Ki67. Note Ki67-positive cells outside of the SVZ in 2-yr-old Tlx-OE mice but not in wild-type mice, and in transgenic animals at the age of 17 mo. Bar, 100 μm. (B) Coronal sections from aged animals as indicated stained with DCX. Note that more DCX-positive cells migrate out of the SVZ in the aged Tlx-OE mice, and more DCX-positive cells are found in the 2-yr-old Tlx-OE mice compared with 17-mo-old Tlx-OE mice (arrows). Bar, 50 μm. (C) Changes of Ki67-positive cells in the SVZ during aging. Note a decrease of cell proliferation in the SVZ of both wild-type and Tlx-OE mice. However, the number of Ki67-positive cells is significantly higher in Tlx-OE mice in all age groups (n = 3, P < 0.05, mean ± standard deviation [SD]), with aged Tlx-OE mice showing Ki67 indices comparable with those of young wild-type mice. (D) Tlx staining of 24-mo-old SVZ of wild-type and Tlx-OE brains. Note that more Tlx-expressing cells are present in the Tlx-OE SVZ. (E) BrdU feeding experiment was performed on 24-mo-old animals, and mice were analyzed for BrdU and NeuN costaining 7 wk after withdrawal of BrdU. Bar, 20 μm.
Figure 4.
Figure 4.
Tlx-OE mice spontaneously develop glioma-like lesions and gliomas. (A) Confocal optical sections of coronal sections of 9-mo-old Tlx-OE mice stained with DCX. Note that DCX-expressing cells migrate out of the SVZ and form glioma-like lesions with a high cell density (arrows). (B) Confocal optical sections of coronal sections of 9-mo-old Tlx-OE mice stained with GFAP. Note that the cellular lesion in the striatum is strongly GFAP-positive (arrow). (C) Confocal optical sections of coronal sections of 9-mo-old Tlx-OE mice stained with DCX (red) and Ki67 (green). Note that the double-positive cells are highly proliferating and migrating. Bar, 10 μm. (D) H&E-stained Tlx-OE brain coronal sections and DCX-stained (inset, red) Tlx-OE brain coronal sections. Note that the migrating cells are associated with white matter tracts (arrows). (E) H&E staining. Arrow indicates a satellitosis-like perineuronal structure around the lesion. (F,G) H&E staining of gliomas from some 2-yr-old Tlx-OE mice. (N) Necrosis.
Figure 5.
Figure 5.
Brain tumor development from SVZ of Tlx-OE mice upon loss of p53. (A) Two-month-old mice were injected with BrdU 2 h before sacrifice, and coronal sections were stained with Ki67. Note Ki67-positive cells outside of the SVZ in Tlx-OE;p53−/− mice (arrows). (B) Two-month-old mice were injected with BrdU 2 h before sacrifice, and coronal sections were stained with BrdU. Arrows indicate BrdU-positive cells in the striatum of Tlx-OE;p53−/− mice. (C) Two-month-old mice were injected with BrdU 2 h before sacrifice, and coronal sections were stained with DCX (red) and Ki67 (green). Note that p53−/− mice do not show migration of the SVZ proliferating cells toward the striatum in comparison with Tlx-OE;p53−/− mice (arrows). (D) Three-month-old Tlx-OE;p53−/− mice develop hyperproliferative lesions as indicated by H&E and Ki67 staining. (E) Tlx-OE;p53−/− mice spontaneously develop gliomas. (Panel a) Tumor sections stained with H&E. Note a highly cellular, small cell glioma with diffuse infiltration of the adjacent brain. Arrows indicate tumor cell clusters migrating to neighboring regions. Bar, 100 μm. (Panel b) Tumor sections stained with H&E. Accumulation of tumor cell clusters in the subpial zone of the cortex (arrow). Bar, 50 μm. (Panel c) Strong expression of GFAP in tumors. Bar, 50 μm. (Panel d) The tumor cells are highly proliferative, as indicated by Ki67 staining. The proliferation index of the depicted tumor was ∼15%, with a higher density of Ki67-positive cells at the tumor periphery. Bar, 50 μm. (Panel e) More proliferating cells are located at the border of the tumor (arrow). Bar, 50 μm. (Panel f) Tumor sections stained with the Tlx antibody. Arrows indicate Tlx-positive cells. Bar, 50 μm. (Panel g) Interspersed NeuN-positive neurons in the tumor tissue (arrows). Bar, 50 μm. (Panel h) Perineuronal satellitosis characterized by tumor cells surrounding NeuN+ neurons (arrows). (Panel i) Mash1 immunoreactivity in Tlx-induced tumors. Bar, 15 μm. (Panel j) Some tumor cells are P-Akt-positive, indicating an alteration of the Pten/Pi3k/Akt pathway; the inset indicates a tumor-free striatal region. (Panel k) Nestin is highly expressed by Tlx overexpression-induced gliomas. (l) DCX is strongly expressed by infiltrating tumor cells.
Figure 6.
Figure 6.
Tlx overexpression leads to increased angiogenesis and subsequent neural progenitor cell (NPC) invasion. (A) H&E staining of brain sections from Tlx-OE;p53−/− mice. Arrows indicate multifocal glioma-like lesions with high cell density. Bar, 50 μm. (B) Adjacent sections from A were stained with Ki67. (Inset) Note that the multifocal lesions are Ki67-positive, and that an endothelial-like structure is associated with the lesions (arrow). Bar, 50 μm. (C) Adjacent sections from A were stained with DCX. Note that the lesions are DCX-positive, indicating a highly invasive nature. (D) Brain sections from Tlx-OE mice that contain glioma-like lesions were stained with Tlx (green) and DCX (red). Note that there are Tlx-expressing isolated cells around the lesion, but they are negative for DCX. (E) Brain sections from wild-type and Tlx-OE mice were stained for VEGFR2. Note that Tlx-OE mice display higher expression of VEGFR2 in the SVZ. (F) Tlx (green) and CD31 (red) staining demonstrates that Tlx-expressing cells are located in a vascular niche in wild-type and Tlx-OE SVZ. (G) Tlx-positive cells are located preferentially in the vascular niche in the wild-type SVZ. The distance between Tlx-expressing cells and the closest vessel was measured, and is presented as percentage of positive cells at different distances to vessels (>1000 Tlx-positive cells were analyzed). (H) Numbers of vessels in the SVZ of wild-type and Tlx-OE mice. Note that only the vessels that are CD31-positive and longer than 50 μm were counted (n = 5, P < 0.05, mean ± standard deviation [SD]). (I) Histological analyses indicate more blood vessels close to the SVZ of Tlx-OE;p53−/− mice compared with p53−/− mice (arrows). (Inset) An adjacent section demonstrates that SVZ cells of the Tlx-OE;p53−/− mice accumulate at the surface of a vessel (arrow). Bar, 50 μm. (J) The top vessel in I (arrow) is highly VEGFR2-positive. (K) The bottom vessel in I is proliferating as indicated by CD31 and BrdU staining. BrdU was injected 2 h before sacrifice. (L) Primary neurospheres derived from the SVZ of Tlx-OE;p53−/− and p53−/− mice were stained with VEGFR2. Note the higher intensity of VEGFR2 staining in Tlx-OE;p53−/− neurospheres. (M) DCX and CD31 staining demonstrates the migration of neural progenitor cells along blood vessels (arrows). (N) Sections from the border of the gliomas from Tlx-OE;p53−/− mice were stained with Tlx and CD31. Note that Tlx-positive cells are also located in a perivascular niche (arrows).
Figure 7.
Figure 7.
Expression of Tlx in human gliomas. (A) Elevated expression of NR2E1 (Tlx) in human gliomas. Box plot representing the expression of NR2E1 in three glioma entities when compared with a normal brain. Data were obtained for diffuse astrocytoma (AII, n = 8), anaplastic astrocytoma (AAIII, n = 14), and primary glioblastoma (pGBM, n = 41). The fold change factor is calculated from comparisons with the expression data of eight normal brains simultaneously analyzed. Note that nine of 41 primary glioblastomas show significant overexpression of NR2E1. (B) NR2E1 amplification from one of two human glioblastoma cases. ArrayCGH was performed with the same set of tumors described in A. Two cases have genomic amplification of NR2E1. Note that these two cases are from the nine cases that showed increased expression of Tlx from A. (C) Human glioblastoma sections were costained for Tlx (green) and nestin (red). Note that only a subpopulation (11.2% ± 4.3%, n = 5) of nestin-positive cells express Tlx. (D) Human glioblastoma sections were costained with Tlx (green) and CD31 (red). Note that Tlx-positive cells are located in a perivascular niche. (E) Cellular composition of the adult SVZ in wild-type mice comprising the astrocyte-like B cells, the transient amplifying type C cells, and the migrating type A cells. Note that Tlx is expressed exclusively by astrocyte-like B cells in the adult SVZ, and that a vascular niche is involved in the maintenance of the stem cell population. (BV) Blood vessel; (E) ependymal; (LV) lateral ventricle. (F) Tlx overexpression induces an increase of neural stem/progenitor cells and, as a consequence, the SVZ cell populations expand. In parallel, angiogenesis is stimulated by overexpression of Tlx. The neural stem/progenitor cells migrate along the vessels and invade neighboring regions. Tlx-positive glioma-initiating cells (BTSCs) are located in a perivascular niche and induce tumor formation.

References

    1. Aguirre AA, Chittajallu R, Belachew S, Gallo V. NG2-expressing cells in the subventricular zone are type C-like cells and contribute to interneuron generation in the postnatal hippocampus. J Cell Biol. 2004;165:575–589. - PMC - PubMed
    1. Alcantara Llaguno S, Chen J, Kwon CH, Jackson EL, Li Y, Burns DK, Alvarez-Buylla A, Parada LF. Malignant astrocytomas originate from neural stem/progenitor cells in a somatic tumor suppressor mouse model. Cancer Cell. 2009;15:45–56. - PMC - PubMed
    1. Alvarez-Buylla A, Garcia-Verdugo JM. Neurogenesis in adult subventricular zone. J Neurosci. 2002;22:629–634. - PMC - PubMed
    1. Androutsellis-Theotokis A, Leker RR, Soldner F, Hoeppner DJ, Ravin R, Poser SW, Rueger MA, Bae SK, Kittappa R, McKay RD. Notch signalling regulates stem cell numbers in vitro and in vivo. Nature. 2006;442:823–826. - PubMed
    1. Antonchuk J, Sauvageau G, Humphries RK. HOXB4-induced expansion of adult hematopoietic stem cells ex vivo. Cell. 2002;109:39–45. - PubMed

Publication types

MeSH terms

Substances