Comparative Study
. 2010 May;16(5):991-1006.
doi: 10.1261/rna.1947110. Epub 2010 Apr 1.

Systematic comparison of microarray profiling, real-time PCR, and next-generation sequencing technologies for measuring differential microRNA expression

Affiliations
Comparative Study

Systematic comparison of microarray profiling, real-time PCR, and next-generation sequencing technologies for measuring differential microRNA expression

Anna Git et al. RNA. 2010 May.

Abstract

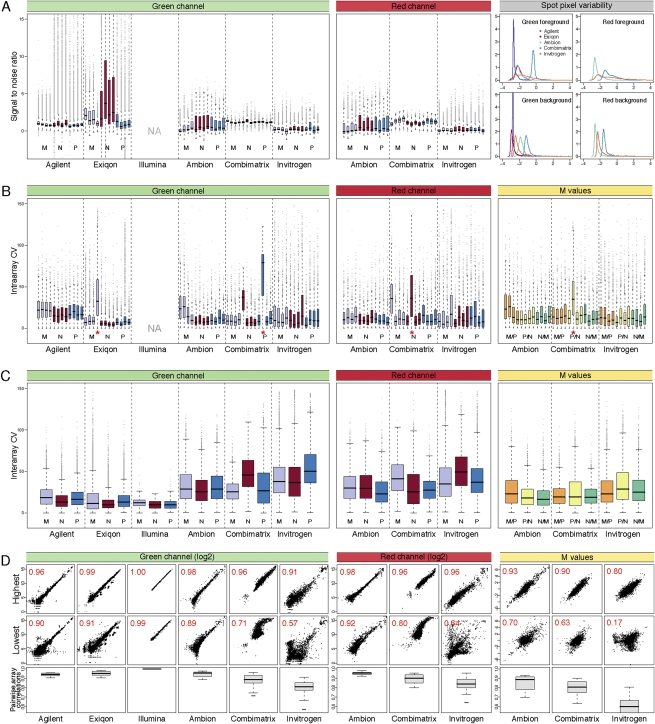
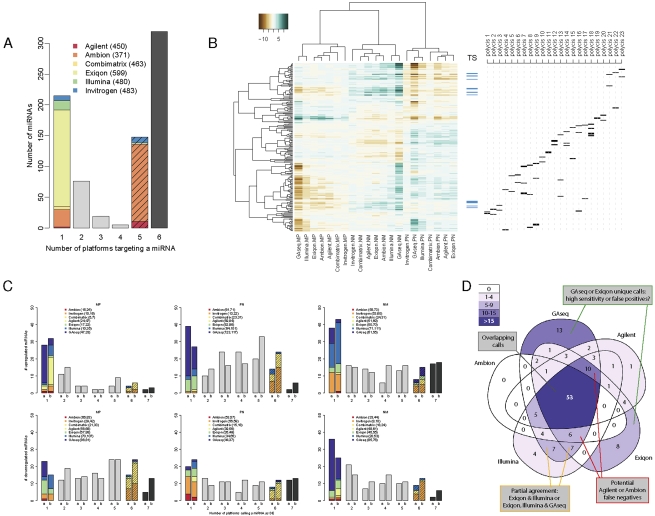
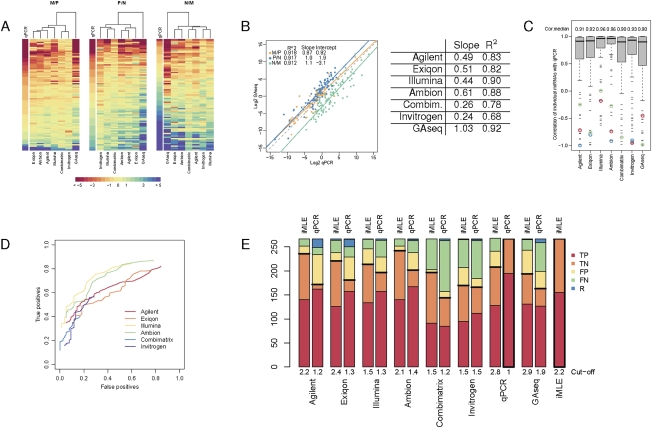
RNA abundance and DNA copy number are routinely measured in high-throughput using microarray and next-generation sequencing (NGS) technologies, and the attributes of different platforms have been extensively analyzed. Recently, the application of both microarrays and NGS has expanded to include microRNAs (miRNAs), but the relative performance of these methods has not been rigorously characterized. We analyzed three biological samples across six miRNA microarray platforms and compared their hybridization performance. We examined the utility of these platforms, as well as NGS, for the detection of differentially expressed miRNAs. We then validated the results for 89 miRNAs by real-time RT-PCR and challenged the use of this assay as a "gold standard." Finally, we implemented a novel method to evaluate false-positive and false-negative rates for all methods in the absence of a reference method.


Figures

FIGURE 1.
FIGURE 1.
Analysis of hybridization performance. (A) Signal-to-noise ratio for the raw 532 nm/Cy3 (green banner) and 635 nm/Cy5 (red banner) intensities for all spots on the individual arrays was calculated using the SSDR method. For Illumina arrays, this calculation was impossible as only the foreground intensities were available. Purple indicates arrays with M samples; red, N, and blue, P. For clarity of presentation, the y-axis was truncated at 15, thereby excluding some extreme outliers. The distribution of the log2 standard deviation between pixels within each spot scaled to the median spot intensity is shown on the right (gray banner). (B) Intra-array coefficients of variation across replicated spots on each array were calculated for the unprocessed Cy3 and Cy5 intensities (bar and banner colors as above), and the log2 ratios (M-values, yellow banner; orange bars indicates M/P; yellow; P/N, green, N/M). Arrays with a red asterisk were excluded from subsequent analysis. (C) Interarray coefficients of variation were calculated for arrays hybridized with the same samples (bar and banner colors as above). (D) Pairwise correlations for arrays hybridized with the same samples were calculated (15–18 correlations). Distribution of R2 values are shown in box plots (bottom row), with the highest (top row) and lowest (middle row) correlations shown as examples. The axis for the bottom row was truncated at 0.55 for clarity, excluding some of the values for Invitrogen.
FIGURE 2.
FIGURE 2.
Analysis of detected probes. (A) Consistency of present/absent calls among human miRNAs. (Top) For each human probe, the percentage of replicates detected (called present) by the platform was calculated and summarized (bars). The numbers above the bars indicate number of probe replicates. (Bottom) Intensity distribution of human miRNAs (black) and the empty and negative spots used to calculate the nonspecific binding (red), with the number of probes of each type listed below the plot. Illumina array data are missing from panels A and B, as information regarding negative or empty spots was not available. (B) Detected spot types. Probes have been categorized based on their target miRNAs (see Materials and Methods). The number of unique spots from each category being detected as “present” in >90% of its replicates across all arrays was calculated for each of the three samples types. For categories with 10 or more present probes, the count is shown next to the figure, with the proportion of the “present” calls out of the total probes in that category (%). The radius of each chart is proportional to the total number of present spots, indicated above. The legend is shared with panel C. PosControl and NegControl are positive and negative controls, respectively; MM_human, mismatched human. (C) Intensity range of the different spot types. For each of the spot types of panel B, the distribution of intensities of background-corrected and normalized green or red log2 values across all arrays was calculated.
FIGURE 3.
FIGURE 3.
Analysis of differential expression. (A) miRNA targeting by platforms. The number of reannotated miRNAs targeted by varying numbers of platforms was calculated. Solid colors indicate miRNAs found only on the indicated platform; striped colors, miRNAs found on all platforms except the indicated platform. The total number of human miRNAs on each platform is indicated in parenthesis. Black bar indicates 319 miRNAs represented on all microarrays. (B) Clustering of the common probe M-values. M-values of 204 human probes common to all microarray platforms with no predicted cross-hybridization and detectable by GAseq were subjected to unsupervised clustering using Pearson correlation. Ticks indicate the position of potential tumor suppressor (TS) miRNAs (blue) and miRNAs arising from a single genomic location contained in a putative polycistronic pri-miRNA (black). A list of polycistrons is provided in Supplemental file “Polycistrons.” (C) Consistency of DE calls by all platforms. The number of platforms calling each miRNA as DE (up-regulated, top; down-regulated, bottom) in each of the three biological comparisons was recorded. DE calls were derived (1) using a uniform threshold of log2 fold-change>1 or (2) using optimal thresholds calculated for each platform by the iMLE algorithm. The overall number of relevant DE calls made by each platform is indicated in parenthesis. (D) Overlap in DE calls of five platforms. The number of miRNAs called by five platforms as up-regulated in P versus N sample using iMLE-optimized cutoffs was plotted inside a Venn diagram. Areas are shaded according to number of DE calls and their relative sizes bear no meaning.
FIGURE 4.
FIGURE 4.
Validation by real-time RT-PCR. (A) M-values of miRNAs tested by qPCR. Eighty-nine miRNAs validated by qPCR (rows) are sorted by their qPCR M-values. Platforms (columns) are clustered by Euclidean distance. (B) Overall correlation between GAseq and qPCR data. For each biological comparison, the ratios of miRNA expression calculated from GAseq were plotted against those derived from qPCR. Best linear regression fit (solid lines; R^2 values, intercept with y-axis and slope indicated in legend); Y = X (dotted line). Average correlations and slopes across the three comparisons are listed for each platform compared to qPCR. (C) Correlation between microarray/NGS and qPCR data. Boxes depict the distribution of correlation for the M-values generated by qPCR and indicated platforms for each miRNA in all three comparisons (MP, PN, NM), and the median value (Cor.median) is indicated above. Examples of consistent outliers are circled; hsa-miR-484 (red), hsa-miR-15a (green), and hsa-miR-215 (blue). (D) Effect of DE cutoff on the TP and FP rate of each platform. The number of TP and FP DE calls, compared with qPCR calls at fold-change >2 was calculated across a range of thresholds (0–5 in 0.1 increments). Only miRNAs with P-value <0.05 were included for each platform; hence, the ROC curves do not cover the entire range of TP and FP rates. (E) True and false call rates of each platform at optimal cutoffs. The number of TP and FP and FN DE calls was calculated at the optimal log2 cutoffs calculated based on a qPCR reference or on the iMLE algorithm with qPCR as an unknown platform. The number of DE (equivalent to TP) and non-DE (equivalent to TN) calls made by these references is shown with a thick frame. A horizontal black thick line separates true calls (below) from false calls (above). Abbreviations as in panel C.

References

    1. Ach RA, Wang H, Curry B 2008. Measuring microRNAs: Comparisons of microarray and quantitative PCR measurements, and of different total RNA prep methods. BMC Biotechnol 8: 69. - PMC - PubMed
    1. Barbato C, Giorgi C, Catalanotto C, Cogoni C 2008. Thinking about RNA? MicroRNAs in the brain. Mamm Genome 19: 541–551 - PubMed
    1. Baumbusch LO, Aaroe J, Johansen FE, Hicks J, Sun H, Bruhn L, Gunderson K, Naume B, Kristensen VN, Liestol K, et al. 2008. Comparison of the Agilent, ROMA/NimbleGen, and Illumina platforms for classification of copy number alterations in human breast tumors. BMC Genomics 9: 379. - PMC - PubMed
    1. Bissels U, Wild S, Tomiuk S, Holste A, Hafner M, Tuschl T, Bosio A 2009. Absolute quantification of microRNAs by using a universal reference. RNA 15: 2375–2384 - PMC - PubMed
    1. Bueno MJ, de Castro IP, Malumbres M 2008. Control of cell proliferation pathways by microRNAs. Cell Cycle 7: 3143–3148 - PubMed

MeSH terms