

Differential polarization of alveolar macrophages and bone marrow-derived monocytes following chemically and pathogen-induced chronic lung inflammation
- PMID: 20360403
- PMCID: PMC2892523
- DOI: 10.1189/jlb.0609378
Differential polarization of alveolar macrophages and bone marrow-derived monocytes following chemically and pathogen-induced chronic lung inflammation
Abstract
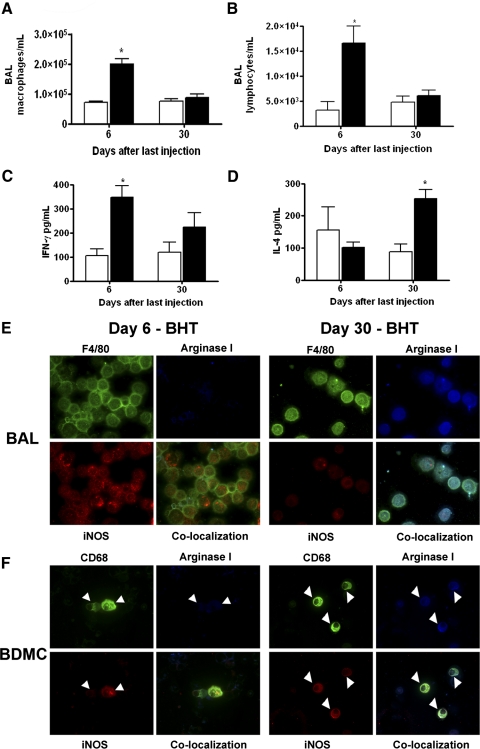
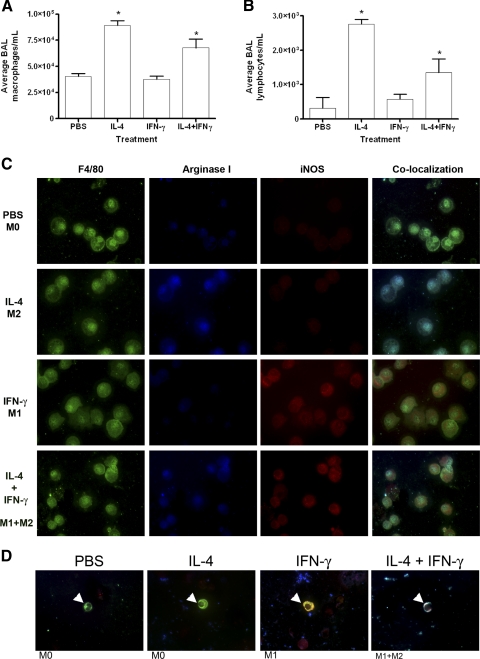
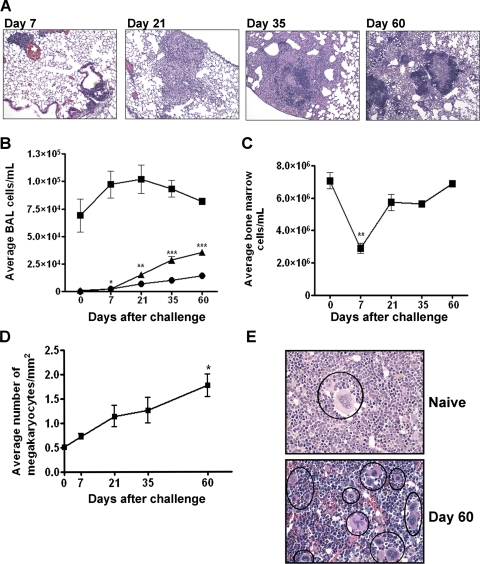
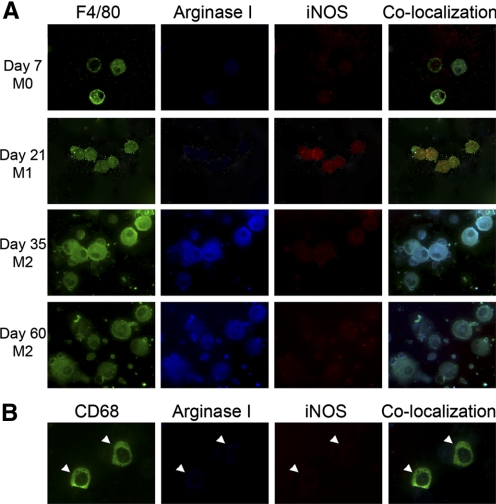
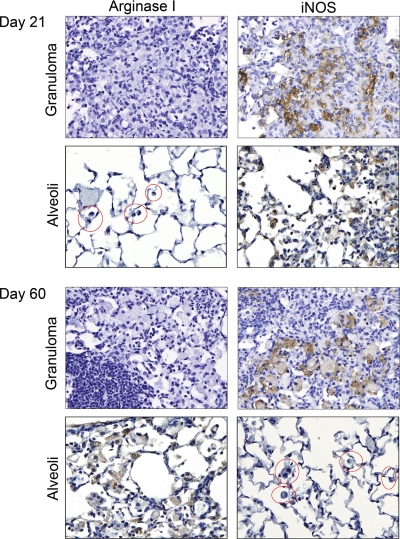
Alveolar macrophages and BDMCs undergo sequential biochemical changes during the chronic inflammatory response to chemically induced lung carcinogenesis in mice. Herein, we examine two chronic lung inflammation models-repeated exposure to BHT and infection with Mycobacterium tuberculosis-to establish whether similar macrophage phenotype changes occur in non-neoplastic pulmonary disease. Exposure to BHT or M. tuberculosis results in pulmonary inflammation characterized by an influx of macrophages, followed by systemic effects on the BM and other organs. In both models, pulmonary IFN-gamma and IL-4 production coincided with altered polarization of alveolar macrophages. Soon after BHT administration or M. tuberculosis infection, IFN-gamma content in BALF increased, and BAL macrophages became classically (M1) polarized, as characterized by increased expression of iNOS. As inflammation progressed in both models, the amount of BALF IFN-gamma content and BAL macrophage iNOS expression decreased, and BALF IL-4 content and macrophage arginase I expression rose, indicating alternative/M2 polarization. Macrophages present in M. tuberculosis-induced granulomas remained M1-polarized, implying that these two pulmonary macrophage populations, alveolar and granuloma-associated, are exposed to different activating cytokines. BDMCs from BHT-treated mice displayed polarization profiles similar to alveolar macrophages, but BDMCs in M. tuberculosis-infected mice did not become polarized. Thus, only alveolar macrophages in these two models of chronic lung disease exhibit a similar progression of polarization changes; polarization of BDMCs was specific to BHT-induced pulmonary inflammation, and polarization of granuloma macrophages was specific to the M. tuberculosis infection.
Figures
Similar articles
-
Tumor progression stage and anatomical site regulate tumor-associated macrophage and bone marrow-derived monocyte polarization.Am J Pathol. 2010 Jun;176(6):2972-85. doi: 10.2353/ajpath.2010.090879. Epub 2010 Apr 29. Am J Pathol. 2010. PMID: 20431028 Free PMC article.
-
Sequential Co-infection of Heligmosomoides polygyrus and Mycobacterium tuberculosis Determine Lung Macrophage Polarization and Histopathological Changes.Indian J Tuberc. 2021 Jul;68(3):340-349. doi: 10.1016/j.ijtb.2020.10.008. Epub 2020 Oct 24. Indian J Tuberc. 2021. PMID: 34099199
-
Infection of Mycobacterium tuberculosis Promotes Both M1/M2 Polarization and MMP Production in Cigarette Smoke-Exposed Macrophages.Front Immunol. 2020 Aug 20;11:1902. doi: 10.3389/fimmu.2020.01902. eCollection 2020. Front Immunol. 2020. PMID: 32973788 Free PMC article.
-
Origin and production of inflammatory perivascular macrophages in pulmonary hypertension.Cytokine. 2017 Dec;100:11-15. doi: 10.1016/j.cyto.2017.08.015. Epub 2017 Aug 30. Cytokine. 2017. PMID: 28855075 Free PMC article. Review.
-
Macrophage Polarization: Different Gene Signatures in M1(LPS+) vs. Classically and M2(LPS-) vs. Alternatively Activated Macrophages.Front Immunol. 2019 May 24;10:1084. doi: 10.3389/fimmu.2019.01084. eCollection 2019. Front Immunol. 2019. PMID: 31178859 Free PMC article. Review.
Cited by
-
Susceptibility to Intracellular Infections: Contributions of TNF to Immune Defense.Front Microbiol. 2020 Jul 15;11:1643. doi: 10.3389/fmicb.2020.01643. eCollection 2020. Front Microbiol. 2020. PMID: 32760383 Free PMC article. Review.
-
Protective effect of suppressing STAT3 activity in LPS-induced acute lung injury.Am J Physiol Lung Cell Mol Physiol. 2016 Nov 1;311(5):L868-L880. doi: 10.1152/ajplung.00281.2016. Epub 2016 Sep 16. Am J Physiol Lung Cell Mol Physiol. 2016. PMID: 27638904 Free PMC article.
-
Single cell RNA sequencing identifies unique inflammatory airspace macrophage subsets.JCI Insight. 2019 Mar 7;4(5):e126556. doi: 10.1172/jci.insight.126556. eCollection 2019 Mar 7. JCI Insight. 2019. PMID: 30721157 Free PMC article.
-
Friends and foes of tuberculosis: modulation of protective immunity.J Intern Med. 2018 May 27:10.1111/joim.12778. doi: 10.1111/joim.12778. Online ahead of print. J Intern Med. 2018. PMID: 29804292 Free PMC article.
-
Biliverdin Reductase A (BVRA) Mediates Macrophage Expression of Interleukin-10 in Injured Kidney.Int J Mol Sci. 2015 Sep 18;16(9):22621-35. doi: 10.3390/ijms160922621. Int J Mol Sci. 2015. PMID: 26393580 Free PMC article.
References
-
- Kobzik L, Bredt D S, Lowenstein C J, Drazen J, Gaston B, Sugarbaker D, Stamler J S. Nitric oxide synthase in human and rat lung: immunocytochemical and histochemical localization. Am J Respir Cell Mol Biol. 1993;9:371–377. - PubMed
-
- American Lung Association Lung Disease Data2006. 2006:1–97. lungusa.org.
-
- Mills C D, Kincaid K, Alt J M, Heilman M J, Hill A M. M-1/M-2 macrophages and the Th1/Th2 paradigm. J Immunol. 2000;164:6166–6173. - PubMed
-
- Gordon S. Alternative activation of macrophages. Nat Rev Immunol. 2003;3:23–35. - PubMed
Publication types
MeSH terms
Substances
Grants and funding
LinkOut - more resources
Full Text Sources
Other Literature Sources
Medical
Research Materials
