. 2010 Aug;109(2):323-31.
doi: 10.1152/japplphysiol.90778.2008. Epub 2010 Apr 1.

Sleep state dependence of ventilatory long-term facilitation following acute intermittent hypoxia in Lewis rats

Affiliations

Sleep state dependence of ventilatory long-term facilitation following acute intermittent hypoxia in Lewis rats

A Nakamura et al. J Appl Physiol (1985). 2010 Aug.

Abstract

Ventilatory long-term facilitation (vLTF) is a form of respiratory plasticity induced by acute intermittent hypoxia (AIH). Although vLTF has been reported in unanesthetized animals, little is known concerning the effects of vigilance state on vLTF expression. We hypothesized that AIH-induced vLTF is preferentially expressed in sleeping vs. awake male Lewis rats. Vigilance state was assessed in unanesthetized rats with chronically implanted EEG and nuchal EMG electrodes, while tidal volume, frequency, minute ventilation (Ve), and CO(2) production were measured via plethysmography, before, during, and after AIH (five 5-min episodes of 10.5% O(2) separated by 5-min normoxic intervals), acute sustained hypoxia (25 min of 10.5% O(2)), or a sham protocol without hypoxia. Vigilance state was classified as quiet wakefulness (QW), light and deep non-rapid eye movement (NREM) sleep (l-NREM and d-NREM sleep, respectively), or rapid eye movement sleep. Ventilatory variables were normalized to pretreatment baseline values in the same vigilance state. During d-NREM sleep, vLTF was observed as a progressive increase in Ve post-AIH (27 + or - 5% average, 30-60 min post-AIH). In association, Ve/Vco(2) (36 + or - 2%), tidal volume (14 + or - 2%), and frequency (7 + or - 2%) were increased 30-60 min post-AIH during d-NREM sleep. vLTF was significant but less robust during l-NREM sleep, was minimal during QW, and was not observed following acute sustained hypoxia or sham protocols in any vigilance state. Thus, vLTF is state-dependent and pattern-sensitive in unanesthetized Lewis rats, with the greatest effects during d-NREM sleep. Although the physiological significance of vLTF is not clear, its greatest significance to ventilatory control is most likely during sleep.


Figures
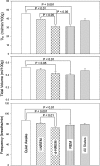
Fig. 1.
Fig. 1.
Absolute values of ventilation (V̇e) and its components tidal volume (Vt) and frequency (f) in each vigilance state: quiet wakefulness (QW), light and deep non-rapid eye movement (NREM) sleep (l-NREM and d-NREM sleep), and rapid eye movement (REM) sleep. Values were obtained during the ∼2-h normoxic period prior to treatments (i.e., baseline). Significant differences are indicated with brackets and associated P values. All ventilatory variables exhibited a similar pattern: QW > l-NREM > d-NREM = REM. Pretreatment ventilatory data were used as baseline measurements for comparison with posttreatment values.
Fig. 2.
Fig. 2.
Time course of rat peritoneal temperature (in 5-min averages, expressed as change from baseline) during and following sham (●), acute intermittent hypoxia (AIH, ○), or acute sustained hypoxia (ASH, ▼) protocol. Peritoneal temperatures prior to any of the 3 treatments were not significantly different; overall baseline peritoneal temperature was 37.9 ± 0.16°C (mean ± SE, n = 12). During AIH and ASH, peritoneal temperature significantly decreased relative to sham, and these values had not returned to baseline 1 h posttreatment.
Fig. 3.
Fig. 3.
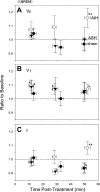
Time course of normalized V̇e during d-NREM sleep following sham (●), AIH (○), or ASH (▼) protocol. A: average V̇e for 0–20, 20–40, and 40–65 min of plethysmograph measurements during d-NREM sleep following each of the 3 gas exposure protocols. Error bars are standard errors (SE) for mean V̇e (vertical bars) and average time of d-NREM measurements made in each time interval (horizontal bars). B–D: V̇e for each individual rat during each 5-min measurement period post-AIH (n = 10), post-sham (n = 12), and post-ASH (n = 9). Shaded area designates 95% confidence limits of quadratic regression relating V̇e with time. Baseline V̇e was determined during d-NREM sleep in the ∼2-h period prior to the experimental protocol. aSignificant difference (P < 0.05) relative to 1.0 (i.e., baseline) and to sham and ASH in the same time period.
Fig. 4.
Fig. 4.
Time course of normalized tidal volume (Vt) during d-NREM sleep following sham (●), AIH (○), or ASH (▼) protocol. A: average Vt for 0–20, 20–40, and 40–65 min of plethysmograph measurements during d-NREM sleep following each of the 3 gas exposure protocols. Error bars are standard errors (SE) for mean Vt (vertical bars) and average time of d-NREM measurements made in each time interval (horizontal bars). B–D: Vt for each individual rat during 5-min measurement periods post-AIH (n = 10), post-sham (n = 12), and post-ASH (n = 9). Shaded area designates 95% confidence limits of quadratic regression relating Vt with time. Baseline Vt was determined during d-NREM sleep in the ∼2-h period prior to the experimental protocol. aSignificant difference (P < 0.05) relative to 1.0 and to sham and ASH in the same time period.
Fig. 5.
Fig. 5.
Time course of normalized respiratory frequency (f) during d-NREM sleep following sham (●), AIH (○), or ASH (▼) protocol. A: average f for 0–20, 20–40, and 40–65 min plethysmograph measurements during d-NREM sleep following each of the 3 gas exposure protocols. Error bars are standard errors (SE) for mean f (vertical bars) and average time of d-NREM measurements made in each time interval (horizontal bars). B–D: f for each individual rat during 5-min measurement periods post-AIH (n = 10), post-sham (n = 12), and post-ASH (n = 9). Shaded area designates 95% confidence limits of quadratic regression relating f with time. Baseline f was determined during d-NREM sleep in the ∼2-h period prior to the experimental protocol. aSignificant difference (P < 0.05) relative to 1.0 and to sham and ASH in the same time period. bSignificant (P < 0.05) difference relative to 1.0. dSignificant (P < 0.05) difference relative to ASH. eSignificant (P < 0.05) difference relative to 0–20 min post-AIH.
Fig. 6.
Fig. 6.
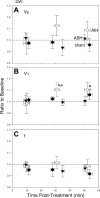
Time course of normalized mean V̇e, Vt, and f during l-NREM sleep for sham (●), AIH (○), and ASH (▼) protocol. Values were averaged between 0–20, 20–40, and 40–65 min posttreatment. aSignificant differences (P < 0.05) relative to 1.0 (i.e., baseline) and to sham and ASH during the same time interval. bSignificant (P < 0.05) difference relative to 1.0 (i.e., baseline) only. cSignificant (P < 0.05) difference relative to sham only. eSignificant (P < 0.05) difference relative to 0–20 min post-AIH.
Fig. 7.
Fig. 7.
Time course of normalized mean V̇e, Vt, and f during quiet wakefulness (QW) for sham (●), AIH (○), or ASH (▼) protocol. Values were averaged between 0–20, 20–40, and 40–65 min posttreatment. bSignificant (P < 0.05) difference relative to 1.0 only. eSignificant (P < 0.05) difference relative to 0–20 min post-AIH.

Similar articles

Cited by

References

    1. Aboubakr SE, Taylor A, Ford R, Siddiqi S, Badr MS. Long-term facilitation in obstructive sleep apnea patients during NREM sleep. J Appl Physiol 91: 2751–2757, 2001 - PubMed
    1. Babcock MA, Badr MS. Long-term facilitation of ventilation in humans during NREM sleep. Sleep 21: 709–716, 1998 - PubMed
    1. Babcock M, Shkoukani M, Aboubakr SE, Badr MS. Determinants of long-term facilitation in humans during NREM sleep. J Appl Physiol 94: 53–59, 2003 - PubMed
    1. Bach KB, Mitchell GS. Hypoxia-induced long-term facilitation of respiratory activity is serotonin dependent. Respir Physiol 104: 251–260, 1996 - PubMed
    1. Baker TL, Mitchell GS. Episodic but not continuous hypoxia elicits long-term facilitation of phrenic motor output in rats. J Physiol 529: 215–219, 2000 - PMC - PubMed

Publication types

LinkOut - more resources