. 2010 Apr 13;107(15):6823-8.
doi: 10.1073/pnas.0912043107. Epub 2010 Apr 1.

Bayesian approach to transforming public gene expression repositories into disease diagnosis databases

Affiliations

Bayesian approach to transforming public gene expression repositories into disease diagnosis databases

Haiyan Huang et al. Proc Natl Acad Sci U S A. .

Abstract

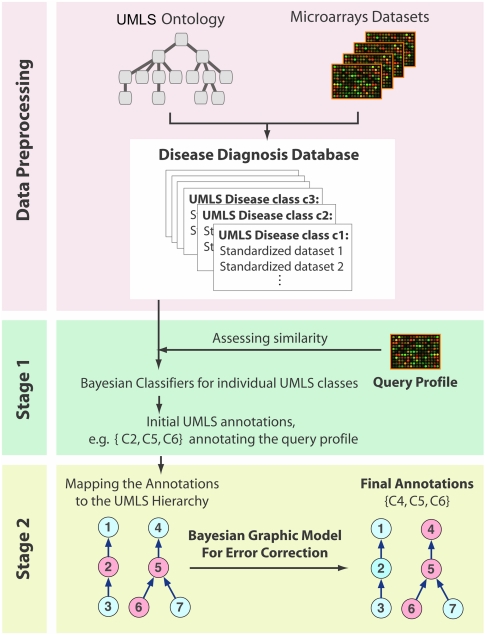
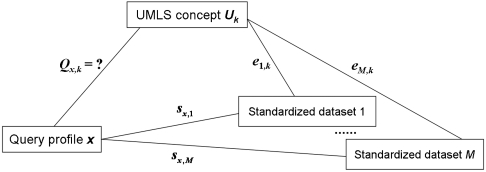
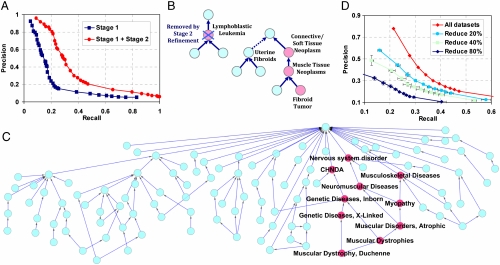
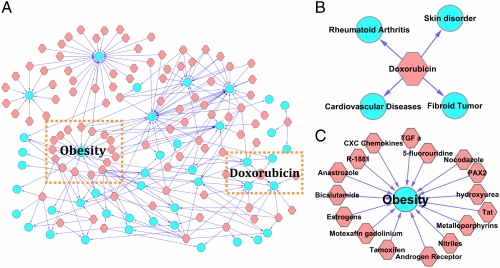
The rapid accumulation of gene expression data has offered unprecedented opportunities to study human diseases. The National Center for Biotechnology Information Gene Expression Omnibus is currently the largest database that systematically documents the genome-wide molecular basis of diseases. However, thus far, this resource has been far from fully utilized. This paper describes the first study to transform public gene expression repositories into an automated disease diagnosis database. Particularly, we have developed a systematic framework, including a two-stage Bayesian learning approach, to achieve the diagnosis of one or multiple diseases for a query expression profile along a hierarchical disease taxonomy. Our approach, including standardizing cross-platform gene expression data and heterogeneous disease annotations, allows analyzing both sources of information in a unified probabilistic system. A high level of overall diagnostic accuracy was shown by cross validation. It was also demonstrated that the power of our method can increase significantly with the continued growth of public gene expression repositories. Finally, we showed how our disease diagnosis system can be used to characterize complex phenotypes and to construct a disease-drug connectivity map.


Conflict of interest statement

The authors declare no conflict of interest.

Figures

Fig. 1.
Fig. 1.
Major steps of the disease diagnosis system: (1) Preprocess the public microarray repositories to build the diagnosis database with standardized expression and phenotype data. (2) Diagnose a query profile via a two-stage Bayesian approach: at the first stage, we build Bayesian classifiers for each UMLS concept; at the second stage, we integrate the individual predictions with a Bayesian network model to allow collaborative error-correction over all classes in the hierarchy (red nodes represent diagnosed disease concepts).
Fig. 2.
Fig. 2.
Information chart for the posterior inference of Qx,k. We wish to estimate the probability that a query profile x is diagnosed with the UMLS concept Uk, given ei,k and sx,i with i = 1,…,M.
Fig. 3.
Fig. 3.
Validation results and case examples. (A) Precision-recall plots by pooled disease classes. The blue curve shows the performance after Stage I diagnosis, and the red curve shows the final performance after Stage II refinement. (B) An example illustrating the error correction by the Stage II refinement. The query profile studies uterine leiomyomas obtained from fibroid afflicted patients (GDS484). The profile is annotated with four concepts by UMLS text mapping: Connective/Soft Tissue Neoplasm, Muscle tissue neoplasm, fibroid tumor, and uterine fibroids. The Stage I diagnosis predicted four concepts (red nodes) with one false positive (lymphoblastic leukemia), and one false negative (uterine fibroids). The false positive prediction is later corrected by Stage II refinement. (C) The figure presents the 110 disease classes and their hierarchical relationships. The red nodes represent diagnosed disease concepts for GDS563: (1) Nervous system disorder (2) Neuromuscular diseases (3) Myopathy (4) Musculoskeletal diseases (5) Congenital, Hereditary, and Neonatal diseases and abnormalities (CHNDA) (6) Genetic diseases, inborn (7) Genetic diseases, x-linked (8) Muscular disorders, atrophic (9) Muscular dystrophies (10) Muscular Dystrophy, Duchenne. (D) The prediction performance decreases with the data reduction.
Fig. 4.
Fig. 4.
Disease-drug connectivity map. The map contains 234 significant connections between 99 drug concepts (pink nodes) and 43 disease concepts (blue nodes). (A) The network structure of the connectivity map. (B) Close-up of the Doxorubicin subnetwork. (C) Close-up of the obesity subnetwork.

Similar articles

Cited by

References

    1. Edgar R, Domrachev M, Lash AE. Gene expression omnibus: NCBI gene expression and hybridization array data repository. Nucleic Acids Res. 2002;30:207–210. - PMC - PubMed
    1. Horton PB, Kiseleva L, Fujibuchi W. RaPiDS: an algorithm for rapid expression profile database search. Genome Inform Ser. 2006;17(2):67–76. - PubMed
    1. Tanner SW, Agarwal P. Gene vector analysis (Geneva): A unified method to detect differentially-regulated gene sets and similar microarray experiments. BMC Bioinformatics. 2008;9(1):348. - PMC - PubMed
    1. Hibbs MA, et al. Exploring the functional landscape of gene expression: directed search of large microarray compendia. Bioinformatics. 2007;23(20):2692–2699. - PubMed
    1. Zhu Y, et al. GEOmetadb: powerful alternative search engine for the Gene Expression Omnibus. Bioinformatics. 2008;24(23):2798–2800. - PMC - PubMed

Publication types