. 2010 Jun 11;285(24):18575-85.
doi: 10.1074/jbc.M109.075085. Epub 2010 Apr 1.

EphA2 mutation in lung squamous cell carcinoma promotes increased cell survival, cell invasion, focal adhesions, and mammalian target of rapamycin activation

Affiliations

EphA2 mutation in lung squamous cell carcinoma promotes increased cell survival, cell invasion, focal adhesions, and mammalian target of rapamycin activation

Leonardo Faoro et al. J Biol Chem. .

Abstract

Non-small cell lung cancer (NSCLC) has a poor prognosis and improved therapies are needed. Expression of EphA2 is increased in NSCLC metastases. In this study, we investigated EphA2 mutations in NSCLC and examined molecular pathways involved in NSCLC. Tumor and cell line DNA was sequenced. One EphA2 mutation was modeled by expression in BEAS2B cells, and functional and biochemical studies were conducted. A G391R mutation was detected in H2170 and 2/28 squamous cell carcinoma patient samples. EphA2 G391R caused constitutive activation of EphA2 with increased phosphorylation of Src, cortactin, and p130(Cas). Wild-type (WT) and G391R cells had 20 and 40% increased invasiveness; this was attenuated with knockdown of Src, cortactin, or p130(Cas). WT and G391R cells demonstrated a 70% increase in focal adhesion area. Mammalian target of rapamycin (mTOR) phosphorylation was increased in G391R cells with increased survival (55%) compared with WT (30%) and had increased sensitivity to rapamycin. A recurrent EphA2 mutation is present in lung squamous cell carcinoma and increases tumor invasion and survival through activation of focal adhesions and actin cytoskeletal regulatory proteins as well as mTOR. Further study of EphA2 as a therapeutic target is warranted.


Figures

FIGURE 1.
FIGURE 1.
EphA2 expression and correlation with survival. A and B, immunohistochemical analysis of EphA2 staining in patient tumor tissue sections. C, Kaplan-Maier analysis of EphA2 expression versus survival. Left panel: patients stratified by EphA2 expression levels, where low and high indicate expression relative to mean expression. Right panel, patients stratified by lung cancer histology subtypes. D, immunoblot analysis of EphA2 expression in various cell lines. Lysates from various cell lines were obtained, run on SDS-PAGE, and immunoblotted with either anti-EphA2 (1) or anti-actin (2) antibody. The cell lines are: A549, SK-LU-1, H1703, H358, H1993, H661, SW1573, H522, H226, H1437, H1838, H1975, and H2170.
FIGURE 2.
FIGURE 2.
EphA2 WT and EphA2 G391R mutation promote anchorage-independent growth. A, immunoblot analysis of EphA2 expression in control, EphA2 wild-type (WT), and EphA2 G391R mutant transfectants. Human EphA2 cDNA (Origene) or human EphA2 cDNA containing the G391R mutation cloned into the pCDNA6.2 vector (Invitrogen), which contains antibiotic resistance genes for selection of stable transfectants in mammalian cells, were transfected into BEAS-2B cells using FuGENE HD (Roche Life Sciences), and cultured in the presence of blasticidin for more than 2 weeks to select only plasmid-containing cells. Cell lysates were then obtained, run on SDS-PAGE, and immunoblotted with anti-EphA2 (1) or anti-actin (2) antibody. B and C, analysis of anchorage-independent growth in control, empty vector (EV), EphA2 wild-type (WT), and EphA2 G391R mutant transfectants. There is a statistically significant increase in soft agar colony formation with WT and G391R transfectants with the G391R having the highest colony forming capacity. A549 cells were used as a positive control.
FIGURE 3.
FIGURE 3.
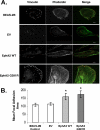
EphA2 WT and EphA2 G391R mutation regulate focal adhesion dynamics. A, immunocytochemical analysis of focal adhesions and the actin cytoskeleton using anti-vinculin antibody (red) and phalloidin (green) in control, empty vector (EV), EphA2 wild-type (WT), and EphA2 G391R SNP transfectants. Immunofluorescence of BEAS-2B cells, with representative untransfected cells depicted in the top row, empty vector cells in the second from the top row, WT-EphA2 cells in the second from bottom row, and G391R-EphA2 in the bottom row. Phenotypically, the EphA2-overexpressing cells tended to be more elongated and contain invadopodia, suggesting a more malignant cellular behavior. In addition, cell size tended to be increased in these EphA2-overexpressing cells. The focal adhesions tended also to have a larger area, which was quantitated and shown to be increased in EphA2-overexpressing cells (see B). B, graphical representation of mean area per focal adhesion (y axis) for control BEAS-2B, empty vector (EV), EphA2 wild-type (WT), and EphA2 G391R SNP transfectants; n = 9 per condition.
FIGURE 4.
FIGURE 4.
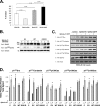
EphA2 and EphA2 G391R mutation promote invasion through activation of Src, cortactin, and p130Cas. A, graphical representation of the percent invasion (y axis) of either control, EphA2 WT, or EphA2 G391R mutant BEAS-2B cells as determined by using the QCM ECMatrix Cell Invasion Assay (Millipore), which measures cell invasion through a 8-μm pore filter covered with basement membrane components. Cells were added to the upper chamber in 0.2% medium, and 10% medium was added to the lower chamber. The cells were analyzed for invasion through basement membrane into the bottom chamber after 24 h. Statistical significance is indicated by bars above each experimental condition; n = 5 per condition. B and C, immunoblotting of BEAS-2B cell lines (control, empty vector (EV), EphA2 wild-type (WT), EphA2 G391R mutation, with and without Ephrin-A1 (1 μg/ml)) and its effect on downstream signaling. B, cell lysates from Ephrin-A1-treatment (0, 5, and 15 min) were obtained, run on SDS-PAGE, and immunoblotted with anti-EphA2, anti-phospho-EphA2 (pTyr594) or anti-actin antibody. C, cell lysates from Ephrin-A1-treatment (0 and 15 min) were obtained, run on SDS-PAGE, and immunoblotted with anti-phospho-Src (pY418) (1), anti-phospho-cortactin (pY421) (2), anti-phospho-p130Cas (pY165) (3), pY249 (4), pY410 (5), anti-EphA2 (6), or anti-actin (7) antibody. D, graphical representation of the ratio of phospho-protein immunoreactivity versus total EphA2 immunoreactivity from experiments described in C. Standardized average gray values for immunoreactive bands of total EphA2, pY418Src, pY421Cortactin, pY165p130Cas, pY249p130Cas, and pY410p130Cas were obtained from BEAS-2B control, empty vector (EV), EphA2 wild-type (WT), and EphA2 G391R mutant cells treated with Ephrin-A1 for 0 or 15 min, and ratios were calculated. The asterisks indicate a statistically significant difference (p < 0.05) between untreated and Ephrin-A1-treated cells; n = 3 per condition.
FIGURE 5.
FIGURE 5.
p130Cas is critical for invasiveness in cells harboring EphA2 G391R. A, immunoblot analysis of BEAS-2B cell lysates indicating complete knockdown of Src, cortactin, and p130Cas protein expression with siRNA treatment. BEAS-2B cells were transfected with siRNA (Santa Cruz Biotechnology) using siPORTamineTM as the transfection reagent (Ambion). Cells (∼40% confluent) were serum-starved for 1 h followed by incubation with 250 nm of target siRNA (or scramble siRNA or no siRNA) for 6 h in serum-free media. The serum-containing media was then added (10% serum final concentration) for 42 h. Cell lysates were obtained, run on SDS-PAGE, and immunoblotted with anti-Src (1), anti-cortactin (2), anti-p130Cas (3), or anti-actin antibody. B, graphical representation of invasion assay results with WT-EphA2 and G391R-EphA2 cells lines showing significant difference in inhibition of invasion between the groups in cells transfected with siRNAs against p130Cas. Knockdown of Src and cortactin significantly reduced cellular invasion by ∼80% with similar effects in WT and G391R cells. However, with p130Cas silencing, the G391R had significantly less (p < 0.05) invasive function compared with the WT-EphA2-overexpressing cells, siRNA#1 refers to siRNA purchased from Santa Cruz Biotechnology, siRNA#2 refers to siRNA purchased from Thermo Scientific; n = 5 per condition.
FIGURE 6.
FIGURE 6.
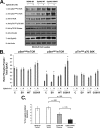
The EphA2 G391R mutation increases cell survival through activation of the mTOR pathway. A, immunoblotting of BEAS-2B cell lines (controls, WT-EphA2, SNP (G391R)-EphA2), with and without ephrin-A1 (1 μg/ml) for 15 min and its effect on mTOR signaling. Cell lysates were obtained, run on SDS-PAGE and immunoblotted with anti-phospho-mTOR (pSer2448) (1) or (pSer2481) (2), anti-mTOR (3), anti-phospho-p70 S6 kinase (pThr389) (4), anti-p70 S6 kinase (5), anti-vinculin (6), anti-EphA2 (7), or anti-actin (8) antibody. B, graphical representation of the ratio of phospho-protein immunoreactivity versus total EphA2 immunoreactivity from experiments described in A. Standardized average gray values for immunoreactive bands of total EphA2, pSer2448mTOR, pSer2481mTOR, and pThr389 p70 S6K were obtained from BEAS-2B control, empty vector (EV), EphA2 wild-type (WT), and EphA2 G391R mutant cells treated with Ephrin-A1 for 0 or 15 min, and ratios were calculated. The asterisks indicate a statistically significant difference (p < 0.05) between untreated and Ephrin-A1-treated cells; n = 3 per condition. C, graphical representation of the percent survival (y axis) of control, empty vector (EV), EphA2 WT, or EphA2 G391R mutant BEAS-2B cells in serum-free media with or without 500 ng/ml Fas ligand treatment for 24 h. EphA2-overexpressing cells displayed significantly increased survival rates (p < 0.05). Furthermore, the mutant (G391R) EphA2 had even higher survival rate when compared with the WT-EphA2 cells (p < 0.05). Untransfected, EV, and EphA2 WT-transfected BEAS-2B cells showed decreased cell survival due to increased Fas ligand-mediated apoptotic events. However, EphA2 G391R-transfected cells showed minimal cell death despite the pro-apoptotic signal.
FIGURE 7.
FIGURE 7.
G391R enhances sensitivity to mTOR inhibition. Cell survival of BEAS-2B control, empty vector (EV), EphA2 wild-type (WT), or EphA2 G391R mutant-expressing cells in culture was assayed in the presence of varying rapamycin concentrations. Survival drops sharply with a 10−5 m (10 μm) rapamycin dose; this effect is more pronounced in cells harboring the G391R mutation. Statistical significance between WT and G391R cells is indicated for 10−6 m (1 μm) and 10−5 (10 μm) rapamycin concentrations.

Similar articles

Cited by

References

    1. Jemal A., Siegel R., Ward E., Murray T., Xu J., Thun M. J. (2007) CA Cancer J. Clin. 57, 43–66 - PubMed
    1. Shibuya K., Mathers C. D., Boschi-Pinto C., Lopez A. D., Murray C. J. (2002) BMC Cancer 2, 37. - PMC - PubMed
    1. Naruke T., Goya T., Tsuchiya R., Suemasu K. (1988) J. Thorac. Cardiovasc. Surg. 96, 440–447 - PubMed
    1. Nesbitt J. C., Putnam J. B., Jr., Walsh G. L., Roth J. A., Mountain C. F. (1995) Ann. Thorac. Surg. 60, 466–472 - PubMed
    1. van Rens M. T., de la Rivière A. B., Elbers H. R., van Den Bosch J. M. (2000) Chest. 117, 374–379 - PubMed

Publication types

MeSH terms

Substances