. 2010 May 19;29(10):1637-51.
doi: 10.1038/emboj.2010.51. Epub 2010 Apr 1.

Pericentrosomal targeting of Rab6 secretory vesicles by Bicaudal-D-related protein 1 (BICDR-1) regulates neuritogenesis

Affiliations

Pericentrosomal targeting of Rab6 secretory vesicles by Bicaudal-D-related protein 1 (BICDR-1) regulates neuritogenesis

Max A Schlager et al. EMBO J. .

Abstract

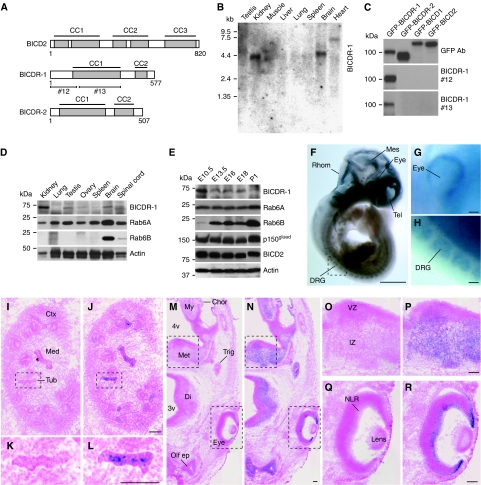
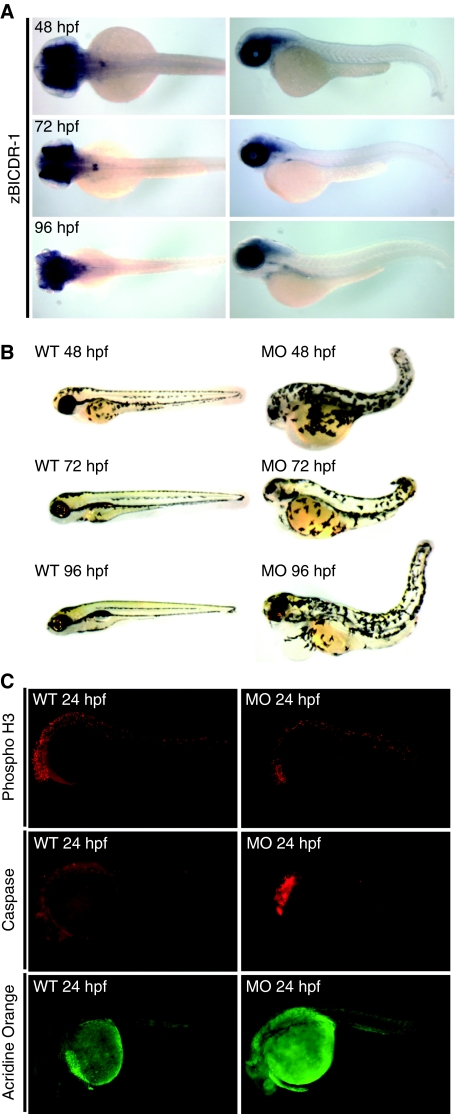
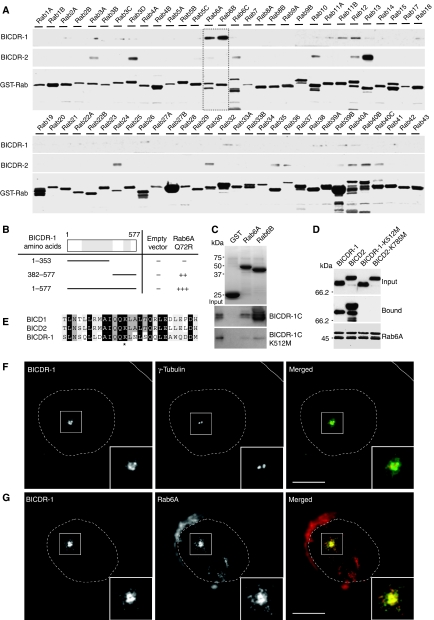
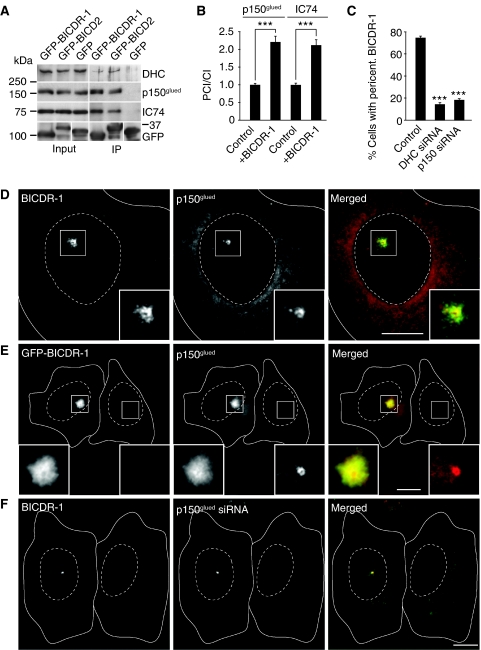
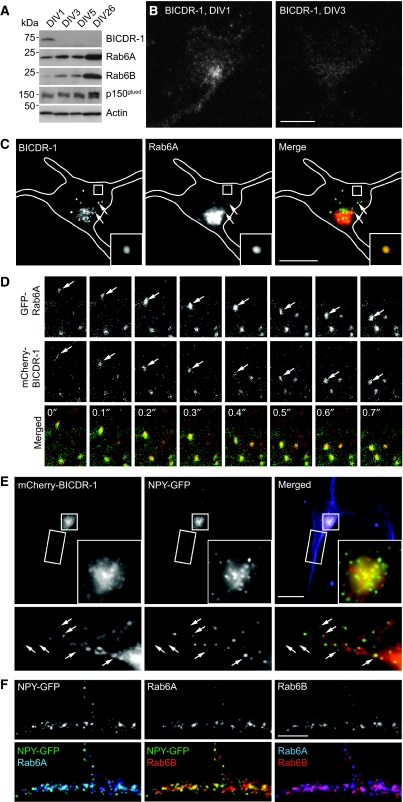
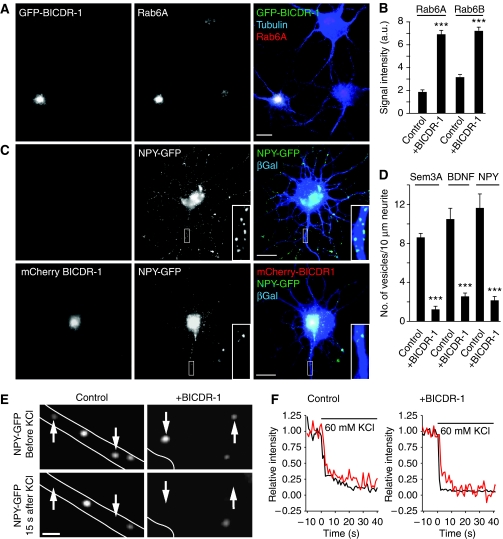
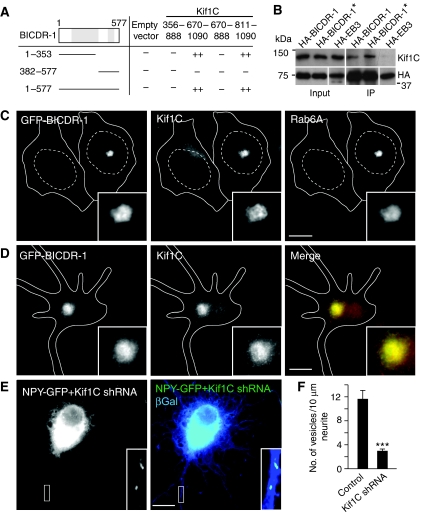
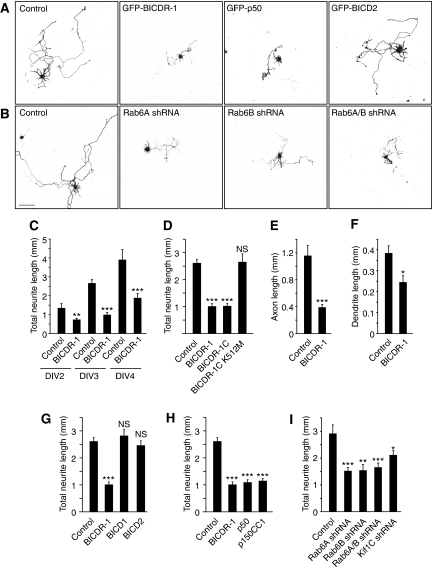
Membrane and secretory trafficking are essential for proper neuronal development. However, the molecular mechanisms that organize secretory trafficking are poorly understood. Here, we identify Bicaudal-D-related protein 1 (BICDR-1) as an effector of the small GTPase Rab6 and key component of the molecular machinery that controls secretory vesicle transport in developing neurons. BICDR-1 interacts with kinesin motor Kif1C, the dynein/dynactin retrograde motor complex, regulates the pericentrosomal localization of Rab6-positive secretory vesicles and is required for neural development in zebrafish. BICDR-1 expression is high during early neuronal development and strongly declines during neurite outgrowth. In young neurons, BICDR-1 accumulates Rab6 secretory vesicles around the centrosome, restricts anterograde secretory transport and inhibits neuritogenesis. Later during development, BICDR-1 expression is strongly reduced, which permits anterograde secretory transport required for neurite outgrowth. These results indicate an important role for BICDR-1 as temporal regulator of secretory trafficking during the early phase of neuronal differentiation.


Conflict of interest statement

The authors declare that they have no conflict of interest.

Figures

Figure 1
Figure 1
BICDR-1 is mainly expressed in kidney and neural tissues during development. (A) Schematic structure of BICD2 and BICDR proteins (CC, coiled-coil region). Antibodies were raised against GST-tagged BICDR-1 fusion proteins containing amino acids 1–146 (antibody #12) and 161–387 (antibody #13). (B) Expression of BICDR-1 mRNA in various rat tissues. (C) BICDR-1 antibodies #12 and #13 specifically recognize GFP-tagged BICDR-1 not the homologous proteins BICDR-2, BICD1 or BICD2. (D) Western blot analysis of BICDR-1, Rab6A and Rab6B in various mouse tissues. (E) Developmental expression patterns of BICDR-1, Rab6A, Rab6B, p150glued and BICD2 in E10.5 (whole embryo), E13.5, E16, E18 and P1 (head only) mouse. (FH) Lateral view of E10 mouse embryo hybridized with a BICDR-1-specific ribo-probe. Indicated structures: dorsal root ganglion (DRG); mesencephalon (Mes); rhombencephalon (Rhom); telencephalon (Tel). Scale bar in (F) 1 mm in (GH) 100 μm. (IL) Transverse cryosections (10 μm) of an E13.5 mouse kidney, hybridized with a BICDR-1 sense (I, K) or anti-sense (J, L) ribo-probe. Indicated structures: cortical region of metanephros (Ctx); medullary region of metanephros (Med); and metanephric tubule (Tub). Scale bars, 100 μm. (MR) Transverse cryosections (10 μm) of an E13.5 mouse head, hybridized with a BICDR-1 sense (M, O, Q) or anti-sense (N, P, R) ribo-probe. Indicated structures: fourth ventricle (4v); third ventricle (3v); choroid plexus (Chor); myencephalon (My); metencephalon (Met); diencephalon (Di); trigeminal (V) ganglion (Trig); olfactory epithelium (Olf ep); ventricular zone (VZ); intermediate zone (IZ); neural layer of retina (NLR). Scale bars, 100 μm.
Figure 2
Figure 2
BICDR-1 has a critical role in zebrafish neural and eye development. (A) Dorsal and lateral views of zebrafish fixed and in situ hybridized with zBICDR-1-specific probe at 48, 72 or 96 hpf. (B) Lateral views of wild type (WT) and zBICDR-1 morphant fish (MO) at 48, 72 or 96 hpf. (C) Lateral views of wild type (WT) and morphant fish (MO) labelled with phospho-H3 or caspase-specific antibodies or acridine orange.
Figure 3
Figure 3
BICDR-1 binds Rab6A/B and is localized pericentrosomally. (A) GST pull-down assay with GST-Rabs (Rab1–43) and extracts of Cos7 cells expressing Flag-BICDR-1 or Flag-BICDR-2. Flag-tagged proteins were detected by western blotting with antibodies against Flag; GST proteins were visualized using Amido Black. (B) Yeast two-hybrid analysis. Rab6A-Q72R was linked to LexA and BICDR-1 (1–577), (1–353) or (382–577) was fused to a GAL4 activation domain. Interaction strength was scored according to the time needed for a β-galactosidase reporter to generate visible blue-coloured yeast colonies on X-Gal containing filters in a colony filter lift assay: +++0–30 min, ++30–60 min, +60–180 min and − no β-galactosidase activity. (C) In vitro binding assay using purified GST-Rab6A/B bound to beads and purified His-BICDR-1C or His-BICDR-1C-K512M. His-tagged proteins were detected by western blotting with antibodies against His; GST-Rab6A/B was visualized by Coomassie staining. (D) GST pull-down assay with GST-Rab6A and extracts of Cos7 cells expressing Flag-BICDR-1, Flag-BICD2, Flag-BICDR-1-K512M or Flag-BICD2-K785M. Flag-tagged proteins were detected by western blotting with antibodies against Flag; GST-Rab6A was visualized using Amido Black. (E) Sequence alignment of BICD1, BICD2 and BICDR-1 Rab6-binding region (* indicates site of BICD2-K785M and BICDR-1-K512M mutations). (F) Co-staining of BICDR-1 (green) and γ-tubulin (red) in a Vero cell. (G) Representative image of a Vero cell co-stained for endogenous BICDR-1 (green) and Rab6A (red). (FG) Solid lines indicate the cell edge and dashed lines indicate the nucleus. The insets show magnifications of boxed areas. Scale bars, 10 μm.
Figure 4
Figure 4
BICDR-1 interacts with the dynein/dynactin motor complex. (A) Immunoprecipitations from extracts of Hela cells transfected with the indicated constructs and probed for DHC, p150glued or dynein intermediate chain 74 (IC74). (B) Ratio of pericentrosomal versus cytoplasmic p150glued or IC74 fluorescence intensity in cells with and without GFP-BICDR-1 overexpression (average ±s.e.m.; p150glued control, n=29; p150glued+BICDR-1, n=30; IC74 control, n=32; IC74+BICDR-1, n=19 cells). (C) Percentage of cells, transfected with indicated siRNAs, with endogenous pericentrosomal BICDR-1 (average ±s.e.m.; control, n=3040; DHC siRNA, n=533; p150glued, n=792 cells). (D) Representative image of a Vero cell stained for endogenous BICDR-1 (green) and for p150glued (red). (E) Representative image of Hela cells with and without GFP-BICDR-1 (green) overexpression stained for p150glued (red). (F) Vero cells transfected with p150glued-specific siRNA (right) and untransfected (left). Stained for BICDR-1 (green) and p150glued (red). (DF) Solid lines indicate the cell edge and dashed lines indicate the nucleus. The insets show magnifications of boxed areas. Scale bars, 10 μm. ***P<0.001.
Figure 5
Figure 5
BICDR-1 is expressed during early stages of neuronal development and is associated with Rab6-positive secretory vesicles in neurons. (A) Developmental expression of BICDR-1, Rab6A, Rab6B, p150glued and actin in cultured hippocampal neurons at DIV1, DIV3, DIV5 and DIV26. (B) Immunofluorescent images of BICDR-1 in hippocampal neurons at DIV1 (left) and DIV3 (right). (C) DIV1 neuron fixed and stained for BICDR-1 (green) and Rab6A (red). (D) Time-lapse images of a DIV2 neuron transfected with mCherry-BICDR-1 (red) and GFP-Rab6A. Time indicated in seconds. (E) DIV2+2 hippocampal neuron transfected with mCherry-BICDR-1 (red) and NPY-GFP (green) and stained for Tuj1 (blue). The insets show magnifications of the boxed areas, arrows indicate co-localization (Pearson's coefficient, rp=0.8). (F) Detail of DIV1+3 hippocampal neuron transfected with NPY-GFP (green) and stained for Rab6A (blue) and Rab6B (red). Merged images show co-localization of NPY-GFP/Rab6A (rp=0.9), NPY-GFP/Rab6B (rp=0.8) and Rab6A/Rab6B (rp=0.8). (B, C, E) Solid lines indicate the cell edge; the insets show magnifications of boxed areas and arrows indicate co-localization. Scale bars, 10 μm. (F) Scale bar, 5 μm.
Figure 6
Figure 6
BICDR-1 controls the trafficking of secretory vesicles in neurons. (A) Representative image of hippocampal neurons transfected with GFP-BICDR-1 (green) and stained for Rab6A (red) and α-tubulin (blue). (B) Quantification of Rab6A and Rab6B immunostaining intensities in hippocampal neurons transfected with GFP-BICDR-1 (average ±s.e.m.; Rab6A control, n=21; Rab6A+BICDR-1, n=10; Rab6B control, n=31; Rab6B+BICDR-1, n=16 cells). (C) DIV2+2 hippocampal neurons transfected with either NPY-GFP (green) and β-Gal (blue; top row) or NPY-GFP (green), mCherry-BICDR-1 (red) and β-Gal (blue; bottom row). (D) Quantification of the number of GFP-labelled vesicles per 10 μm neurite in DIV2+2 hippocampal neurons transfected with indicated constructs (average ±s.e.m.; Sem3A control, n=10; Sem3A+BICDR-1, n=10; BDNF control, n=5; BDNF+BICDR-1, n=5; NPY control, n=5; NPY+BICDR-1, n=5). (E) Time-lapse images of DIV4+1 hippocampal neurons transfected with NPY-GFP and mCherry (control, axon) or NPY-GFP, mCherry and HA-BICDR-1 (+BICDR-1, cell body) before and after stimulation by addition of KCl (60 mM final concentration). Scale bar, 1 μm; arrows indicate secreting vesicles; solid lines indicate the cell edge. (F) Fluorescence intensity traces of secretory events in the axon (control) or cell body (+BICDR-1) during KCl addition. ***P<0.001.
Figure 7
Figure 7
BICDR-1 interacts with Kif1C. (A) Yeast two-hybrid analysis. Kif1C (356–888), (670–1090), (670–888) or (811–1090) was linked to LexA and BICDR-1 (1–577), (1–353) or (382–577) was fused to a GAL4 activation domain. Interaction strength was scored according to the time needed for β-galactosidase reporter to generate visible blue-coloured yeast colonies on X-Gal containing filters in a colony filter lift assay: +++0–30 min, ++30–60 min, +60–180 min and − no β-galactosidase activity. (B) Immunoprecipitations from extracts of Hela cells transfected with the indicated constructs and probed for Kif1C (* indicates that cells were treated with 1 μM staurosporin for 1 h before immunoprecipitation). (C) Representative image of Hela cells with and without GFP-BICDR-1 overexpression stained for Kif1C and Rab6A. (D) DIV2+two hippocampal neuron transfected with GFP-BICDR-1 (green) and stained for Kif1C (red). (E) DIV1+three hippocampal neurons transfected with either NPY-GFP (green), Kif1C shRNA and β-Gal (blue). (F) Quantification of the number of GFP-labelled vesicles per 10 μm neurite in DIV1+three hippocampal neurons transfected with indicated constructs (average ±s.e.m.; control, n=5; NPY+Kif1C shRNA, n=6). (CE) Solid lines indicate the cell edge and dashed lines indicate the nucleus. The insets show magnifications of boxed areas. Scale bars, 10 μm. ***P<0.001.
Figure 8
Figure 8
BICDR-1 regulates neurite outgrowth. (A, B) Hippocampal neurons co-transfected at DIV0.25 with indicated constructs and β-Gal to visualize morphology, fixed at DIV3. Scale bar, 100 μm. (C) Total neurite length after 2-, 3- or 4-day overexpression of GFP-BICDR-1 or an empty pGW1-HA vector as control (DIV2 control n=9, BICDR-1 n=14; DIV3 control n=11, BICDR-1 n=12; DIV4 control n=14, BICDR-1 n=16). (D) Total neurite length after 3-day overexpression of GFP-BICDR-1, GFP-BICDR-1C or GFP-BICDR-1C-K512M. Control cells were transfected with an empty pGW1-HA vector (control n=37; BICDR-1 n=23; BICDR-1C n=15; BICDR-1C-K512M n=11). (E) Axon length after 3-day overexpression of GFP-BICDR-1 or an empty pGW1-HA vector as control (control n=9; BICDR-1 n=9). (F) Dendrite length after 3-day overexpression of GFP-BICDR-1 or an empty pGW1-HA vector as control (control n=14; BICDR-1 n=9). (G) Total neurite length after 3-day overexpression of GFP-BICDR-1 or GFP-BICD2. Control cells were transfected with an empty pGW1-HA vector (control n=37; BICDR-1 n=23; BICD1 n=12; BICD2 n=19). (H) Total neurite length after 3-day overexpression of GFP-BICDR-1, GFP-p50 or GFP-p150CC1. Control cells were transfected with an empty pGW1-HA vector (control n=37; BICDR-1 n=23; p50 n=15; p150CC1 n=17). (I) Total neurite length after 3-day overexpression of shRNA specific for Rab6A, Rab6B, Rab6A and Rab6B or Kif1C. Control cells were transfected with an empty pSuper vector (control n=14; Rab6A shRNA n=21; Rab6B shRNA n=10; Rab6A/B shRNA n=16; Kif1C shRNA n=13). (CI) Average ±s.e.m., *P<0.05. **P<0.01. ***P<0.001.

Comment in

Similar articles

Cited by

References

    1. Babb SG, Kotradi SM, Shah B, Chiappini-Williamson C, Bell LN, Schmeiser G, Chen E, Liu Q, Marrs JA (2005) Zebrafish R-cadherin (Cdh4) controls visual system development and differentiation. Dev Dyn 233: 930–945 - PubMed
    1. Barkus RV, Klyachko O, Horiuchi D, Dickson BJ, Saxton WM (2008) Identification of an axonal kinesin-3 motor for fast anterograde vesicle transport that facilitates retrograde transport of neuropeptides. Mol Biol Cell 19: 274–283 - PMC - PubMed
    1. Bonifacino JS, Glick BS (2004) The mechanisms of vesicle budding and fusion. Cell 116: 153–166 - PubMed
    1. Bradke F, Dotti CG (2000) Differentiated neurons retain the capacity to generate axons from dendrites. Curr Biol 10: 1467–1470 - PubMed
    1. Bullock SL, Ish-Horowicz D (2001) Conserved signals and machinery for RNA transport in Drosophila oogenesis and embryogenesis. Nature 414: 611–616 - PubMed

Publication types