. 2010 Apr 21;29(8):1446-57.
doi: 10.1038/emboj.2010.38. Epub 2010 Apr 1.

High-resolution profiling of gammaH2AX around DNA double strand breaks in the mammalian genome

Affiliations

High-resolution profiling of gammaH2AX around DNA double strand breaks in the mammalian genome

Jason S Iacovoni et al. EMBO J. .

Abstract

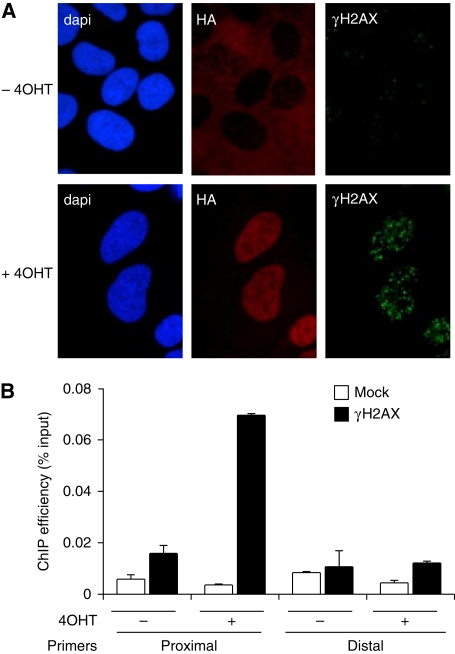
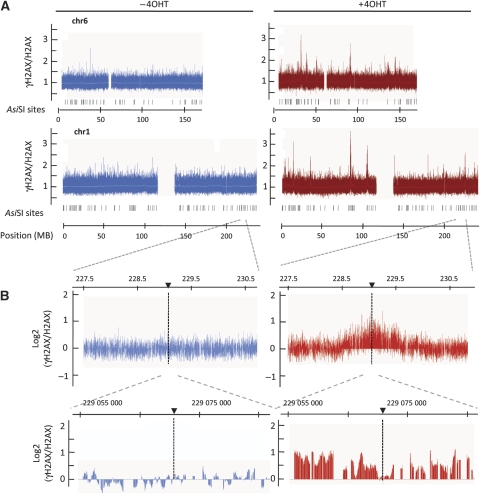
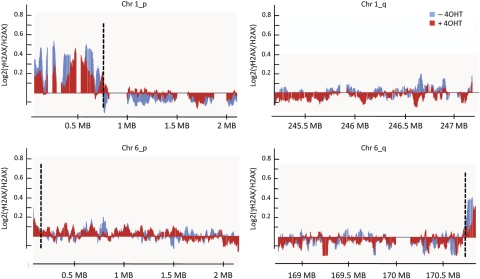
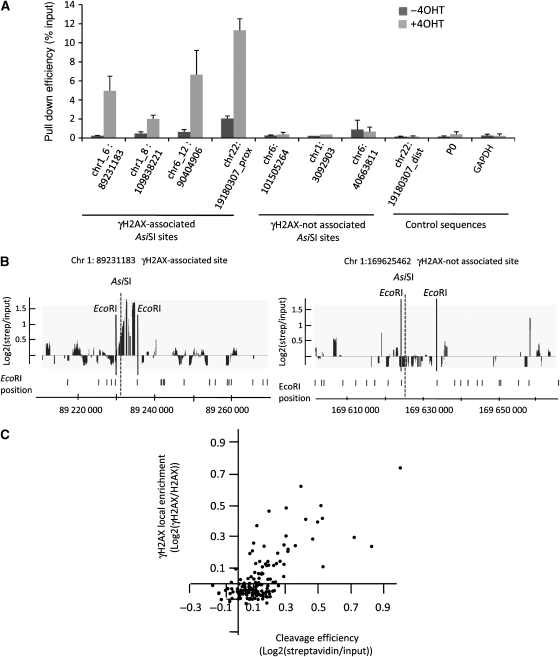
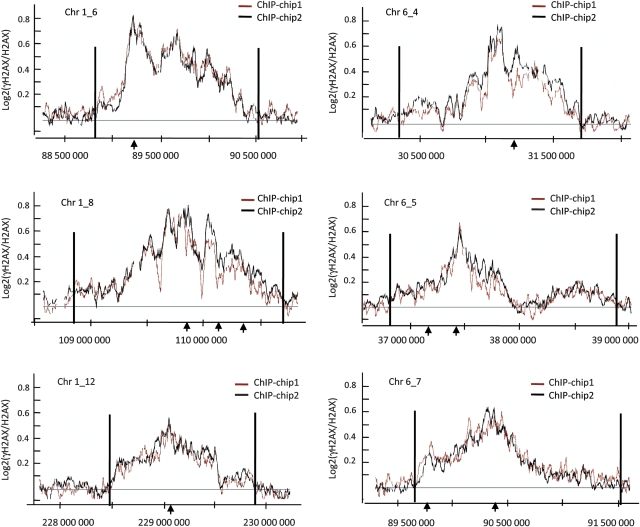
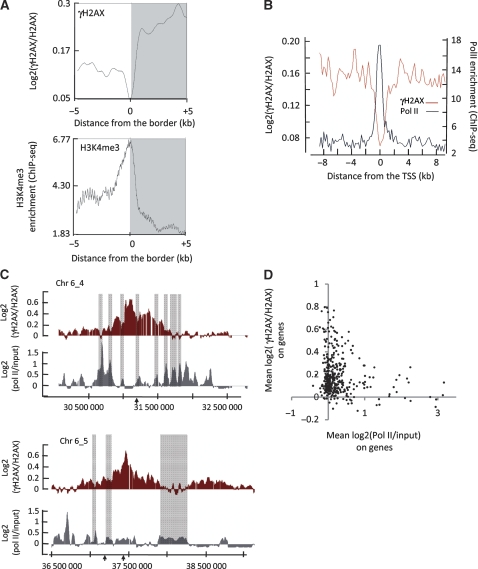
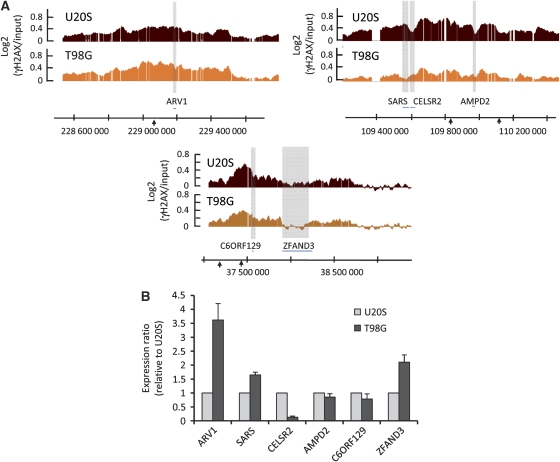
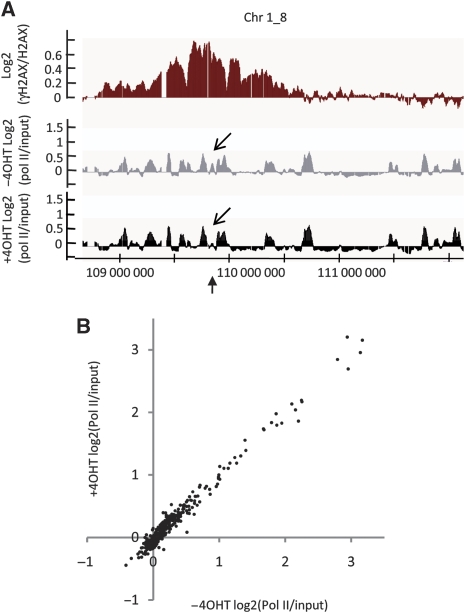
Chromatin acts as a key regulator of DNA-related processes such as DNA damage repair. Although ChIP-chip is a powerful technique to provide high-resolution maps of protein-genome interactions, its use to study DNA double strand break (DSB) repair has been hindered by the limitations of the available damage induction methods. We have developed a human cell line that permits induction of multiple DSBs randomly distributed and unambiguously positioned within the genome. Using this system, we have generated the first genome-wide mapping of gammaH2AX around DSBs. We found that all DSBs trigger large gammaH2AX domains, which spread out from the DSB in a bidirectional, discontinuous and not necessarily symmetrical manner. The distribution of gammaH2AX within domains is influenced by gene transcription, as parallel mappings of RNA Polymerase II and strand-specific expression showed that gammaH2AX does not propagate on active genes. In addition, we showed that transcription is accurately maintained within gammaH2AX domains, indicating that mechanisms may exist to protect gene transcription from gammaH2AX spreading and from the chromatin rearrangements induced by DSBs.


Conflict of interest statement

The authors declare that they have no conflict of interest.

Figures

Figure 1
Figure 1
4OHT treatment induces sequence-specific DSB induction in the AsiSI–ER U20S cell line. (A) U20S cells, which stably express AsiSI–ER–HA, were co-stained with DAPI (DNA) after incubation with antibodies against the HA tag, and γH2AX, before and after 4OHT treatment (4 h). (B) ChIP analysis was performed in AsiSI–ER-U20S cells, before and after a 4 h 4OHT treatment, using an anti γH2AX antibody (Upstate 07-164) or no antibody (mock), as indicated. γH2AX enrichment was assessed by real-time Q–PCR amplification using proximal and distal primers located 3.7 kb and 2 Mb away from the AsiSI site on chr22 at position 19 180 307. The mean and standard deviation for four independent experiments are shown.
Figure 2
Figure 2
γH2AX mapping across two human chromosomes, before and after DSBs induction. (A) γH2AX (Upstate) and H2AX ChIPs were performed on AsiSI–ER-U20S cells, before and after 4 h of 4OHT treatment and were hybridized to the Human Tiling Array 2.0R A that covers chromosomes 1 and 6. The γH2AX/H2AX ratio (linear scale) before (blue, left) and after (red, right) DBS induction is presented. The AsiSI sites positions are also indicated. (B) Detailed views of the log2 γH2AX/H2AX ratio across a region from chromosome 1 before (blue, left) and after 4OHT treatment (red, right). AsiSI site positions are indicated by arrows. An absence of signal reflects the lack of probes on the tilling array because of repetitive sequences.
Figure 3
Figure 3
γH2AX is enriched at telomeres. Detailed views of γH2AX/H2AX enrichment (expressed as a log2 ratio smoothed using a 500 probes sliding window), across the telomeres of chromosomes 1 and 6. ChIP-chip was performed using chromatin from AsiSI–ER-U20S cells treated (red) or not (blue) with 4OHT for 4 h. A representative experiment (performed with the Upstate γH2AX antibody) is shown. The black dotted lines indicate the positions of the boundaries detected by our domain finding algorithm (applied on the average of two independent experiments). γH2AX clearly accumulates on telomeres 1p and 6q and less on telomere 6p. As already reported (Meier et al, 2007), telomere 1q does not show γH2AX enrichment.
Figure 4
Figure 4
Cleavage analysis of AsiSI sites. (A) Genomic DNA was extracted before and after 4OHT treatment and assayed for cleavage at AsiSI sites as described in ‘Materials and methods' section. Pulled down DNA was analysed by Q–PCR amplification to assess cleavage of four γH2AX-enriched and three γH2AX-unenriched AsiSI sites as well as three control sequences, as indicated. Data correspond to mean and standard deviation from three independent experiments. (B) Pulled down DNA was amplified and hybridized to the Human Tiling Array 2.0R A. Data obtained for one γH2AX-enriched (left panel) and one non-γH2AX-enriched AsiSI site are shown. AsiSI and EcoRI sites are indicated. The meaningful signal is expected between the two EcoRI sites surrounding the AsiSI site. (C) The γH2AX signal (averaged on a 20 kb window surrounding the AsiSI site) of each of the 146 analysed AsiSI sites is plotted against the cleavage efficiency (as determined by the streptavidin/input signal averaged between the two flanking EcoRI sites). Cleavage efficiency and γH2AX/H2AX ratios were analysed from two independent experiments.
Figure 5
Figure 5
γH2AX distributes asymmetrically and discontinuously around DSBs. Six γH2AX-enriched domains are shown as examples. The log2 ratios of γH2AX/H2AX ChIP-chip from two independent experiments (+4OHT) were calculated using a sliding window size of 500 probes. The AsiSI sites are indicated by arrows and domains boundaries (as defined by our domain detection algorithm applied to the average of the two experiments) by black lines.
Figure 6
Figure 6
Transcription antagonizes γH2AX enrichment. (A) ‘Holes', or regions depleted in γH2AX within a γH2AX domain, were identified using the algorithm detailed in ‘Materials and methods' section (applied on the average of two 4OHT-treated γH2AX/H2AX ChIP-chip analyses). In all, 534 hole borders were aligned and overlaid (right and mirror left borders are combined). Profiles are shown for γH2AX (upper panel) and H3K4me3 (lower panel), over a 10 kb window centred on the border of the holes and averaged using a 500 base window size. ChIP-seq data for H3K4me3 was retrieved from Barski et al (2007). Note the major change in H3K4me3 signal positioned exactly at the border of the γH2AX holes. (B) The γH2AX/H2AX signal after 4OHT treatment (in red) smoothed using a 200 bp window was plotted relative to the TSS from all 368 genes located within γH2AX domains. Also shown is the Pol II distribution data (in grey), plotted in the same manner, obtained from Barski et al (2007). (C) Detailed views of two γH2AX domains, with γH2AX/H2AX signal in red, Pol II/input signal in grey and AsiSI sites indicated by arrows (signals are expressed as log2 ratios and smoothed using a 500 probes sliding window). Grey boxes indicate peaks of Pol II, which are also depleted in γH2AX. (D) Average log2 ratio plots of Pol II/input (x axis) versus γH2AX/H2AX (y axis) averaged across gene loci from the 368 genes encompassed by γH2AX domains (from the TSS to the end of the gene). Genes that show a high Pol II value also have a low average γH2AX level.
Figure 7
Figure 7
Transcriptional changes account for differences observed between U20S and T98G γH2AX profiles. (A) Detailed views of three γH2AX domains that showed differences between AsiSI–ER-U20S (red) and AsiSI–ER-T98G in G1 phase (orange). Smoothed γH2AX/input signal of representative experiments performed with the Epitomics γH2AX antibody is shown. Grey boxes indicate regions with differences in γH2AX profiles between the two cell lines and gene symbols are indicated below. (B) RNA levels for the genes from the domains shown in (A) were analysed with respect to P0 by RT–Q-PCR, in AsiSI–ER-U20S and AsiSI–ER-T98G (G1 phase). For each gene, the average ratio and standard deviation of cDNA levels in AsiSI–ER-T98G-G1 relative to AsiSI–ER-U20S, obtained by four independent experiments, are shown.
Figure 8
Figure 8
Transcription in γH2AX domains is not affected by DSB induction. (A) Detailed view of a cleaved AsiSI site (bottom arrow) of the γH2AX/H2AX signal (red), or the Pol II/input signal obtained with 4OHT (black) or without 4OHT (grey), expressed as log2 ratios and smoothed using a 500 probes sliding window. Note that Pol II binding within γH2AX domains does not change on 4OHT treatment, except at the immediate vicinity of the AsiSI restriction site (angled arrows). (B) Pol II-binding signals were averaged over each of the 368 genes encompassed in the γH2AX domains, with (y axis) or without (x axis) 4OHT treatment.

Similar articles

Cited by

References

    1. Agger K, Santoni-Rugiu E, Holmberg C, Karlstrom O, Helin K (2005) Conditional E2F1 activation in transgenic mice causes testicular atrophy and dysplasia mimicking human CIS. Oncogene 24: 780–789 - PubMed
    1. Barski A, Cuddapah S, Cui K, Roh TY, Schones DE, Wang Z, Wei G, Chepelev I, Zhao K (2007) High-resolution profiling of histone methylations in the human genome. Cell 129: 823–837 - PubMed
    1. Berkovich E, Monnat RJ Jr, Kastan MB (2007) Roles of ATM and NBS1 in chromatin structure modulation and DNA double-strand break repair. Nat Cell Biol 9: 683–690 - PubMed
    1. Bewersdorf J, Bennett BT, Knight KL (2006) H2AX chromatin structures and their response to DNA damage revealed by 4Pi microscopy. Proc Natl Acad Sci USA 103: 18137–18142 - PMC - PubMed
    1. Celeste A, Fernandez-Capetillo O, Kruhlak MJ, Pilch DR, Staudt DW, Lee A, Bonner RF, Bonner WM, Nussenzweig A (2003) Histone H2AX phosphorylation is dispensable for the initial recognition of DNA breaks. Nat Cell Biol 5: 675–679 - PubMed

Publication types