. 2010 Apr 1;464(7289):721-7.
doi: 10.1038/nature08869.

Phenotypic profiling of the human genome by time-lapse microscopy reveals cell division genes

Affiliations

Phenotypic profiling of the human genome by time-lapse microscopy reveals cell division genes

Beate Neumann et al. Nature. .

Abstract

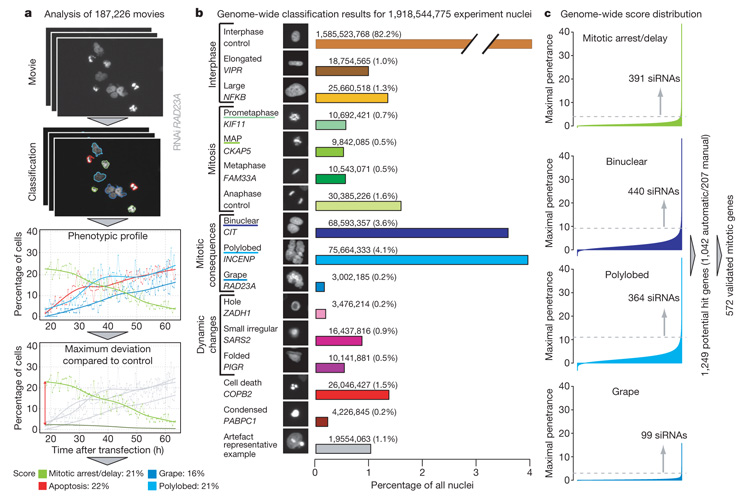
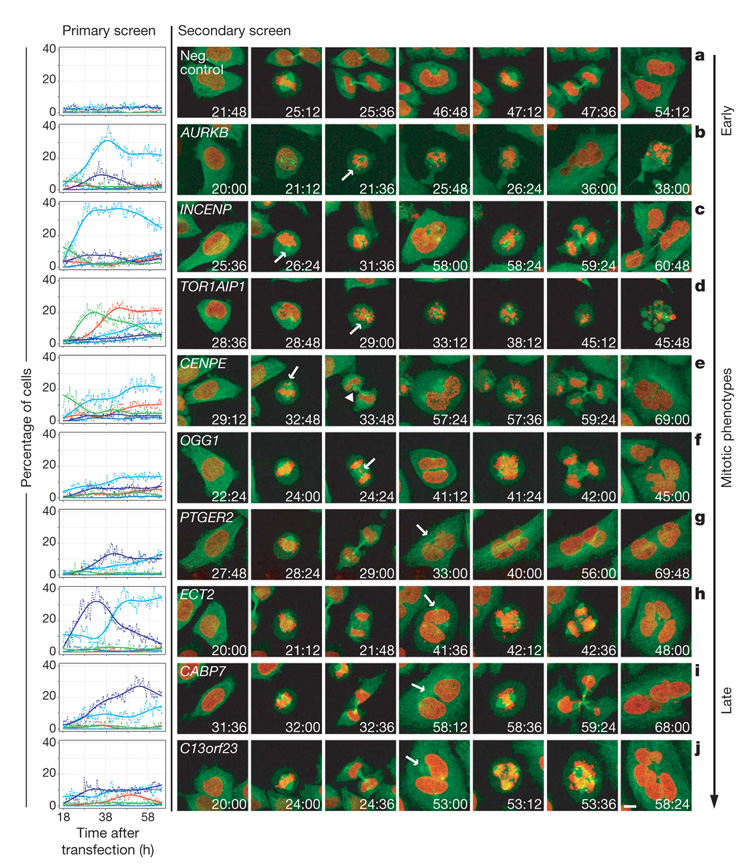
Despite our rapidly growing knowledge about the human genome, we do not know all of the genes required for some of the most basic functions of life. To start to fill this gap we developed a high-throughput phenotypic screening platform combining potent gene silencing by RNA interference, time-lapse microscopy and computational image processing. We carried out a genome-wide phenotypic profiling of each of the approximately 21,000 human protein-coding genes by two-day live imaging of fluorescently labelled chromosomes. Phenotypes were scored quantitatively by computational image processing, which allowed us to identify hundreds of human genes involved in diverse biological functions including cell division, migration and survival. As part of the Mitocheck consortium, this study provides an in-depth analysis of cell division phenotypes and makes the entire high-content data set available as a resource to the community.


Figures

Figure 1
Figure 1. Data analysis and hit detection
a, All nuclei in the 187,226 movies (each consisting in 92 images) are classified into 1 out of 16 predefined morphological classes. The workflow is illustrated for a RAD23A RNAi experiment; for clarity, only four morphological classes are shown: mitotic delay/arrest (prometaphase plus metaphase alignment problems (MAP)), polylobed, grape and cell death. For each morphological class, the score is defined as the maximal difference over time between the relative cell count curve in one morphological class and the corresponding negative control curve, averaged over eight scrambled siRNA experiments on the same slide (shown for mitosis). b, 1,918,544,775 nuclei from all movies (controls removed) classified into 16 different nuclei morphology classes. Classes used for mitotic hit detection are underlined. c, Genome-wide score distribution for the four classes used to detect potential mitotic hits—mitotic delay/arrest (prometaphase plus MAP), binuclear, polylobed and grape—automatically computed for all 51,810 siRNAs. Each siRNA is considered as a potential mitotic hit if the median score of its replicates exceeds a manually defined threshold (dotted lines) in at least one of the four morphological classes.
Figure 2
Figure 2. Rescue experiments
a, HeLa cells and HeLa cells stably expressing 12 different mouse BACs are stained with Hoechst after RNAi knockdowns. The specific mouse proteins could rescue the RNAi nuclear morphology phenotypes (left panel) in all rescues shown (right panel). Scale bars represent 100 μm (left) and 10 μm (right). Out of the 21 rescues performed, 12 (57%) were successful, 3 (14%) partial and 6 (29%) failed (Supplementary Table 6).
Figure 3
Figure 3. Gene Ontology (GO) terms distribution and event order maps
a, GO analysis. Biological process annotations of the 572 validated mitotic hits. To deal with multiple annotations for each gene, categories were arbitrarily ordered by relevance to mitosis and each gene was assigned to the first term from this list that it had been annotated with. The same analysis was performed for the whole set of potential hit genes (1,249) in Supplementary Fig. 3. b, Event order maps. To each gene of the validated mitotic hit list (found by at least two siRNAs), a representative order of phenotypic events and a normalized penetrance score in each of the morphological classes is assigned (Supplementary Methods). For each gene, the event order can be visualized by a sequence of coloured fields where different colours correspond to different phenotypic classes, the colour intensity to the corresponding penetrance and the colour order to the phenotypic event order. The event orders are then centred on the phenotypic classes mitotic delay, polylobed, binuclear and grape. Genes with similar event orders are grouped together, resulting in centred event order maps, where the rows correspond to genes and the columns to the event order relative to the main phenotypic event. On the left, the locations of four genes (MFSD3, HAUS3, RMA, RAB24) in the maps are indicated by grey arrows; the corresponding order of phenotypic events are illustrated on a single cell level (numbers indicate time after transfection (h:min)). The corresponding event order maps for the whole set of potential hit genes (1,249) are shown in Supplementary Fig. 4. Single gene resolution event order maps are shown in Supplementary Fig. 5.
Figure 4
Figure 4. Time-resolved heat map
a, The quantitative time-resolved phenoprints for all validated mitotic hit genes (572) can be used for phenotypic clustering, taking into account both the penetrance values and the joint temporal evolution in several phenotypic classes illustrated at the top of each column. Colour code at the right: reference genes (Supplementary Table 5) with known function are marked in blue (cytokinesis) or green (early mitotic phenotype). On the right, interesting clusters are highlighted. On the left, the dendrogram corresponding to the hierarchical clustering is shown. The same analysis has been performed for the whole set of potential mitotic genes (1,249) in Supplementary Fig. 6. The single gene resolution heat map is available as Supplementary Fig. 7. b, Early mitotic phenotypes (magnified view of the red rectangle at the top of panel a); the rescued gene TOR1AIP1 is highlighted in red. c, Binuclear phenotypes (magnified view corresponding to the red rectangle at the bottom of panel a); the rescued gene CABP7 is highlighted in red. In b and c, the numbers in parentheses represent the identifiers of the siRNAs that produced the phenotypic profile illustrated in the heat map.
Figure 5
Figure 5. Functional analysis of spindle phenotypes
Left panel: phenotypic time curves (colour scheme as in Fig. 1) for nine corresponding RNAi experiments from the primary screen and one negative control experiment (scrambled; top panel). Right panels: confocal still images from movies of HeLa cells stably expressing GFP–tubulin (green) and H2B–mCherry (red) after RNAi knockdown show mitotic phenotypes in the first (b, d, g) cell cycle or mitotic consequences in the following one (a, c, e, f, h–j). First phenotype appearance is indicted by arrows. Mitotic phenotypes are shown in b–f, whereas in the CENPE knockdown (e) the consequence of the non-aligned chromosomes is indicated with an arrowhead. g, Binuclear cells after cytokinesis failure. h–j, Cytokinesis failure followed by the formation of a multipolar spindle during the second cell cycle resulting in multinucleated cells (arrows indicate the centrosomes). Scale bar, 10 μm.

Comment in

Similar articles

Cited by

References

    1. Neumann B, et al. High-throughput RNAi screening by time-lapse imaging of live human cells. Nature Methods. 2006;3:385–390. - PubMed
    1. Walter T, et al. Automatic identification and clustering of chromosome phenotypes in a genome wide RNAi screen by time-lapse imaging. J. Struct. Biol. (in the press) - PubMed
    1. Boland MV, Markey MK, Murphy RF. Automated recognition of patterns characteristic of subcellular structures in fluorescence microscopy images. Cytometry. 1998;33:366–375. - PubMed
    1. Conrad C, et al. Automatic identification of subcellular phenotypes on human cell arrays. Genome Res. 2004;14:1130–1136. - PMC - PubMed
    1. Glory E, Murphy RF. Automated subcellular location determination and high-throughput microscopy. Dev. Cell. 2007;12:7–16. - PubMed

Publication types