

Discriminating natural image statistics from neuronal population codes
- PMID: 20360849
- PMCID: PMC2845616
- DOI: 10.1371/journal.pone.0009704
Discriminating natural image statistics from neuronal population codes
Abstract
The power law provides an efficient description of amplitude spectra of natural scenes. Psychophysical studies have shown that the forms of the amplitude spectra are clearly related to human visual performance, indicating that the statistical parameters in natural scenes are represented in the nervous system. However, the underlying neuronal computation that accounts for the perception of the natural image statistics has not been thoroughly studied. We propose a theoretical framework for neuronal encoding and decoding of the image statistics, hypothesizing the elicited population activities of spatial-frequency selective neurons observed in the early visual cortex. The model predicts that frequency-tuned neurons have asymmetric tuning curves as functions of the amplitude spectra falloffs. To investigate the ability of this neural population to encode the statistical parameters of the input images, we analyze the Fisher information of the stochastic population code, relating it to the psychophysically measured human ability to discriminate natural image statistics. The nature of discrimination thresholds suggested by the computational model is consistent with experimental data from previous studies. Of particular interest, a reported qualitative disparity between performance in fovea and parafovea can be explained based on the distributional difference over preferred frequencies of neurons in the current model. The threshold shows a peak at a small falloff parameter when the neuronal preferred spatial frequencies are narrowly distributed, whereas the threshold peak vanishes for a neural population with a more broadly distributed frequency preference. These results demonstrate that the distributional property of neuronal stimulus preference can play a crucial role in linking microscopic neurophysiological phenomena and macroscopic human behaviors.
Conflict of interest statement
Figures

 . Each curve represents a spectrum with a particular falloff parameter
  from −1 to 2. Contrast-determining parameter
  was set to 0.05 for each image. The thick curve represents the spectrum of an image with
  . (b) Spatial frequency tuning of model neurons within a hypercolumn. Seven example neurons with most-preferred frequencies are spaced evenly from 0.01 to 10 cycles/deg (colored from red to indigo). The tuning curves are modeled with log Gaussian functions. (c) Demonstration of population activity evoked by the images satisfying the power law with different
  values. Dot colors are matched to those in panel b. Each curve links the unit activities evoked by a common stimulus. The thick flat line represents the responses to the image with
  . (d) Hypothetical response curves as functions of
  , derived from activity profiles shown in panel c.
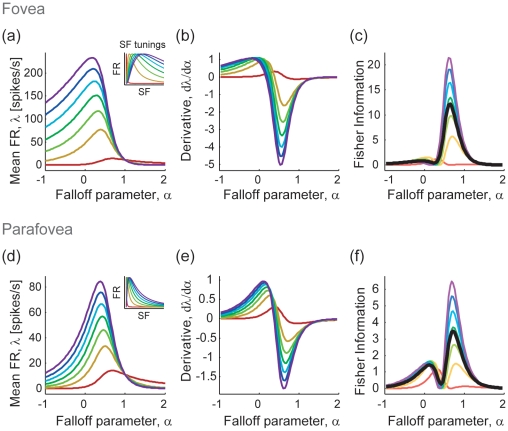
 -tuning curves (identical to Fig. 1d). Inset illustrates the spatial frequency tuning curves and the distribution of the preferred frequencies of the model neurons (same as shown in Fig. 1b). The figure shows seven example units with preferred frequencies spaced evenly from 0.01 to 10 cycles/deg (colored from red to indigo). (b) The derivative functions of the
  -tuning differentiated by the falloff parameter (i.e.,
  ). (c) The local Fisher information of the individual units (thin colored curves) and their average (i.e., information per unit; thick black curve). Colors of curves in panels b and c are matched to those in panel a. (d–f) Same as (a–c), but computed for the parafovea, where the units' preferred spatial frequencies varied from 0.01 to 1 cycles/deg. Seven example units, whose preferred frequencies are spaced evenly from 0.01 to 1 cycle/deg (colored from red to indigo).
 and
and  in Eq. (7) as
  and
and  .
.

 within
  , and then analyzed the averaged contributions for 50 neurons having different preferred spatial frequencies between
  , which are the same as those used in the model fitting in Fig. 5. When compared to the case for no neuronal interaction (gray line), the models with response gain control within the hypercolumn suggest more broad distributions of information both in fovea (brown) and parafovea (red). Note the slightly different result between fovea and parafovea when considering gain control among neurons, because the distribution of cell number
  affects the
  -tuning curves of the individual units.
Similar articles
-
The tuning of human visual cortex to variations in the 1/fα amplitude spectra and fractal properties of synthetic noise images.Neuroimage. 2017 Feb 1;146:642-657. doi: 10.1016/j.neuroimage.2016.10.013. Epub 2016 Oct 11. Neuroimage. 2017. PMID: 27742601
-
A higher order visual neuron tuned to the spatial amplitude spectra of natural scenes.Nat Commun. 2015 Oct 6;6:8522. doi: 10.1038/ncomms9522. Nat Commun. 2015. PMID: 26439748 Free PMC article.
-
Predicting human perceptual decisions by decoding neuronal information profiles.Biol Cybern. 2008 May;98(5):397-411. doi: 10.1007/s00422-008-0226-0. Epub 2008 Mar 29. Biol Cybern. 2008. PMID: 18373103 Free PMC article.
-
Bottom-up and top-down dynamics in visual cortex.Prog Brain Res. 2005;149:65-81. doi: 10.1016/S0079-6123(05)49006-8. Prog Brain Res. 2005. PMID: 16226577 Review.
-
Spatial scale interactions and image statistics.Perception. 1997;26(9):1089-100. doi: 10.1068/p261089. Perception. 1997. PMID: 9509145 Review.
References
-
- Srivastava A, Lee AB, Simoncelli EP, Zhu SC. On advances in statistical modeling of natural images. Journal of mathematical imaging and vision. 2003;18:17–33.
-
- Burton GJ, Moorhead IR. Color and spatial structure in natural scenes. Appl Opt. 1987;26:157–170. - PubMed
-
- Field DJ. Relations between the statistics of natural images and the response properties of cortical cells. J Opt Soc Am A. 1987;4:2379–2394. - PubMed
-
- Tolhurst DJ, Tadmor Y, Chao T. Amplitude spectra of natural images. Ophthalmic Physiol Opt. 1992;12:229–232. - PubMed
-
- Ruderman DL, Bialek W. Statistics of natural images: Scaling in the woods. Phys Rev Lett. 1994;73:814–817. - PubMed
Publication types
MeSH terms
LinkOut - more resources
Full Text Sources
