. 2010 Mar 26;5(3):e9905.
doi: 10.1371/journal.pone.0009905.

SWISS MADE: Standardized WithIn Class Sum of Squares to evaluate methodologies and dataset elements

Affiliations

SWISS MADE: Standardized WithIn Class Sum of Squares to evaluate methodologies and dataset elements

Christopher R Cabanski et al. PLoS One. .

Abstract

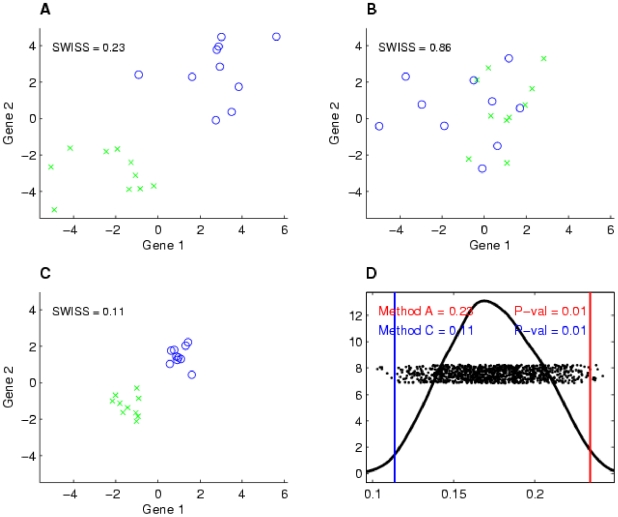
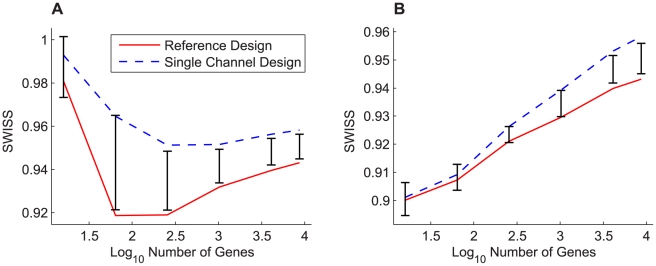
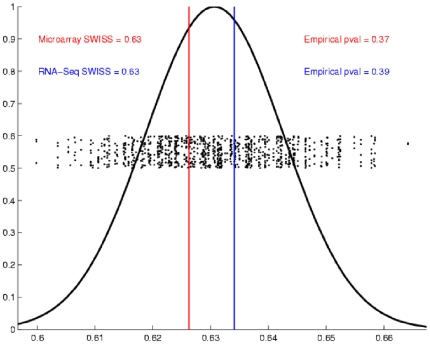
Contemporary high dimensional biological assays, such as mRNA expression microarrays, regularly involve multiple data processing steps, such as experimental processing, computational processing, sample selection, or feature selection (i.e. gene selection), prior to deriving any biological conclusions. These steps can dramatically change the interpretation of an experiment. Evaluation of processing steps has received limited attention in the literature. It is not straightforward to evaluate different processing methods and investigators are often unsure of the best method. We present a simple statistical tool, Standardized WithIn class Sum of Squares (SWISS), that allows investigators to compare alternate data processing methods, such as different experimental methods, normalizations, or technologies, on a dataset in terms of how well they cluster a priori biological classes. SWISS uses Euclidean distance to determine which method does a better job of clustering the data elements based on a priori classifications. We apply SWISS to three different gene expression applications. The first application uses four different datasets to compare different experimental methods, normalizations, and gene sets. The second application, using data from the MicroArray Quality Control (MAQC) project, compares different microarray platforms. The third application compares different technologies: a single Agilent two-color microarray versus one lane of RNA-Seq. These applications give an indication of the variety of problems that SWISS can be helpful in solving. The SWISS analysis of one-color versus two-color microarrays provides investigators who use two-color arrays the opportunity to review their results in light of a single-channel analysis, with all of the associated benefits offered by this design. Analysis of the MACQ data shows differential intersite reproducibility by array platform. SWISS also shows that one lane of RNA-Seq clusters data by biological phenotypes as well as a single Agilent two-color microarray.


Conflict of interest statement

Competing Interests: The authors have declared that no competing interests exist.

Figures

Figure 1
Figure 1. Toy example demonstrating how SWISS measures clustering.
Two-dimensional toy example, with the same axes in plots A–C. The two classes are distinguished by different colors and symbols. Suppose that the same dataset has been processed using three different methods, with the processed data shown in A–C. This toy example demonstrates that data that are clustered better (A and C) have a lower SWISS score than data where there is not much separation between classes (B). This also shows that SWISS scores can be compared even when the data are on different scales (A vs. C). Plot D shows the SWISS permutation test of the data shown in plots A and C. This plot shows the distribution of the permuted population of SWISS scores (black dots), summarized by a smooth histogram (black curve), along with the SWISS scores of Method A (red vertical line) and Method B (blue vertical line). The SWISS scores and corresponding empirical p-values are also reported. Because both p-values are less than 0.05, we conclude that the processing method shown in C is significantly better than the processing method shown in A.
Figure 2
Figure 2. Normalization of single channel design, dataset II.
Comparison of SWISS scores of three different normalization techniques for the single channel of dataset II. The number of genes was varied, as shown by the x-axis. Genes were filtered for each normalization method based on gene variation, keeping the genes with the largest variation. The normalization techniques being compared are loess (solid blue), quantile (dashed green), and no normalization (dot-dashed red). This shows that for each fixed number of genes, quantile and loess normalization are both superior to no normalization, and that loess normalization performs slightly better than quantile normalization.
Figure 3
Figure 3. SWISS permutation test results, datasets I–III.
SWISS hypothesis test results for datasets I–III (A–C). Each plot shows the distribution of the permuted population of SWISS scores (black dots), summarized by a smooth histogram (black curve), along with the SWISS scores of the reference design (red vertical line) and single channel design (blue vertical line). When both p-values are less than 0.05 (as in A and B), we conclude that the method with the smaller SWISS score (the reference design in A and B) is significantly better than the other method (the single channel design). However, if either p-value is greater than 0.05 (as in C), we conclude that there is no significant difference between the reference and single channel designs.
Figure 4
Figure 4. Effect of filtering genes by variance, datasets I–IV.
SWISS scores for the reference design (solid red) and single channel design (dashed blue) along with corresponding 90% confidence intervals (black bars) calculated from the SWISS permutation test are shown for datasets I – III (A – C). The SWISS scores for the self-self hybridization Exp-Cy3 channel (dot-dashed green), Exp-Cy5 channel (solid red), and the average of the two self-self hybridization channels (dashed blue) are shown for dataset IV (D). In A (dataset I), the reference design is always significantly better than the single channel design (because the black bars are always inside the blue and red curves). However, in B and C (datasets II and III), there are certain gene sets where there is a significant difference between the two designs and other gene sets where there is no significant difference. In D, there is very little difference between each of the two experimental channels and the average of the two channels.
Figure 5
Figure 5. Feature selection: comparing identical gene sets, dataset I.
The SWISS scores for the reference design (solid red) and single channel design (dashed blue) along with corresponding 90% confidence intervals (black bars) calculated from the SWISS permutation test are shown for dataset I. The genes for both designs in A were filtered according to variance across all arrays in the single channel design, and the genes in B were filtered according to variance across all arrays in the reference design. The SWISS scores in B are lower than those in A, which suggests that filtering genes using the reference design is better than filtering genes using the single channel design. Also, there are gene filterings in both A and B where there is no significant difference between the single channel and reference designs (both the red and blue lines lie inside the black bars).
Figure 6
Figure 6. SWISS permutation test results, Experimental Application III.
SWISS hypothesis test results for Experimental Application III. Because both p-values are greater than 0.05, we conclude that there is no significant difference between a single Agilent two-color microarray and one lane of RNA-Seq.

References

    1. Armstrong NJ, van de Wiel MA. Microarray data analysis: from hypotheses to conclusions using gene expression data. Cell Oncol. 2004;26:279–290. - PMC - PubMed
    1. Bilban M, Buehler LK, Head S, Desoye G, Quaranta V. Normalizing DNA microarray data. Curr Issues Mol Biol. 2002;4:57–64. - PubMed
    1. Fan J, Ren Y. Statistical analysis of DNA microarray data in cancer research. Clin Cancer Res. 2006;12:4469–4473. - PubMed
    1. Grant GR, Manduchi E, Stoeckert CJ., Jr Analysis and management of microarray gene expression data. Curr Protoc Mol Biol Chapter. 2007;19:Unit 19 16. - PubMed
    1. Quackenbush J. Computational analysis of microarray data. Nat Rev Genet. 2001;2:418–427. - PubMed

Publication types