

Biomarker Development for the Clinical Activity of the mTOR Inhibitor Everolimus (RAD001): Processes, Limitations, and Further Proposals
- PMID: 20360931
- PMCID: PMC2847314
- DOI: 10.1593/tlo.09277
Biomarker Development for the Clinical Activity of the mTOR Inhibitor Everolimus (RAD001): Processes, Limitations, and Further Proposals
Abstract
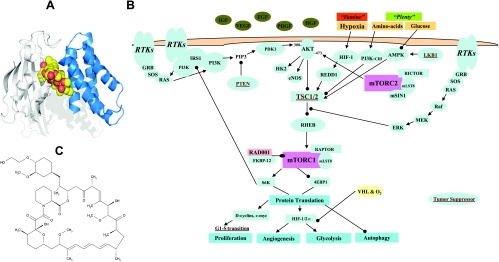
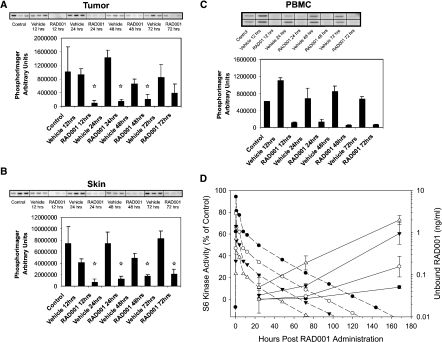
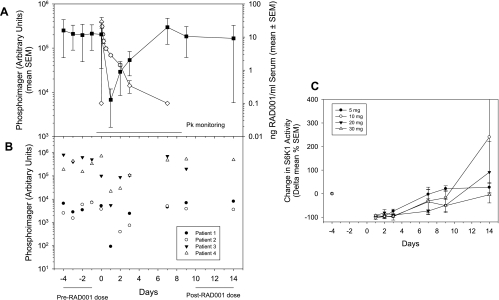
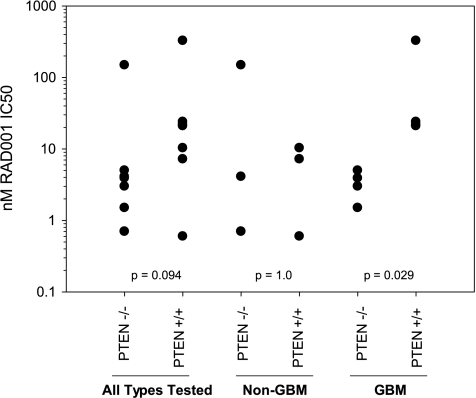
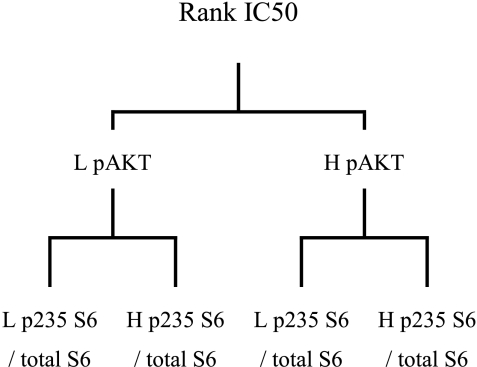
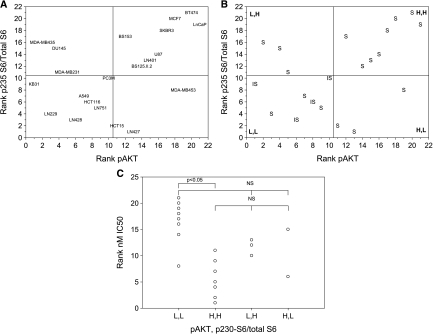
The mTOR inhibitor everolimus (RAD001, Afinitor) is an orally active anticancer agent. Everolimus demonstrates growth-inhibitory activity against a broad range of tumor cell histotypes in vitro and has the capacity to retard tumor growth in preclinical tumor models in vivo through mechanisms directed against both the tumor cell and the solid tumor stroma components. These properties have rendered it to be a clinically active drug, with subsequent registration in renal cell carcinoma (Motzer et al. [2008]. Lancet372, 449-456) as well as showing strong potential as a combination partner (André F et al. [2008]. J Clin Oncol26. Abstract 1003). Although everolimus has a high specificity for its molecular target, the ubiquitous nature of mTOR and the multifactorial influence that mTOR signaling has on cell physiology have made studies difficult on the identification and validation of a biomarker set to predict and monitor drug sensitivity for clinical use. In this review, a summary of the preclinical and clinical data relevant to biomarker development for everolimus is presented, and the advantages and problems of current biomarkers are reviewed. In addition, alternative approaches to biomarker development are proposed on the basis of examples of a combination of markers and functional noninvasive imaging. In particular, we show how basal levels of pAKT and pS6 together could, in principle, be used to stratify patients for likely response to an mTOR inhibitor.
Figures
Similar articles
-
mTOR inhibitor RAD001 (everolimus) has antiangiogenic/vascular properties distinct from a VEGFR tyrosine kinase inhibitor.Clin Cancer Res. 2009 Mar 1;15(5):1612-22. doi: 10.1158/1078-0432.CCR-08-2057. Epub 2009 Feb 17. Clin Cancer Res. 2009. PMID: 19223496
-
Treatment of advanced pancreatic neuroendocrine tumors: potential role of everolimus.Onco Targets Ther. 2012;5:217-24. doi: 10.2147/OTT.S16289. Epub 2012 Apr 3. Onco Targets Ther. 2012. PMID: 22870038 Free PMC article.
-
RAD001 (Everolimus) delays tumor onset and progression in a transgenic mouse model of ovarian cancer.Cancer Res. 2007 Mar 15;67(6):2408-13. doi: 10.1158/0008-5472.CAN-06-4490. Cancer Res. 2007. PMID: 17363557
-
Everolimus for the treatment of advanced renal cell carcinoma.Expert Opin Pharmacother. 2011 May;12(7):1143-55. doi: 10.1517/14656566.2011.571382. Epub 2011 Apr 7. Expert Opin Pharmacother. 2011. PMID: 21470068 Review.
-
Future directions in the treatment of hormone-sensitive advanced breast cancer: the RAD001 (Everolimus)-letrozole clinical program.Semin Oncol. 2006 Apr;33(2 Suppl 7):S18-25. doi: 10.1053/j.seminoncol.2006.03.024. Semin Oncol. 2006. PMID: 16730273 Review.
Cited by
-
Report from the 13th annual Western canadian gastrointestinal cancer consensus conference; calgary, alberta; september 8-10, 2011.Curr Oncol. 2012 Dec;19(6):e468-77. doi: 10.3747/co.19.1167. Curr Oncol. 2012. PMID: 23300370 Free PMC article.
-
Molecular imaging of therapy response with (18)F-FLT and (18)F-FDG following cyclophosphamide and mTOR inhibition.Am J Nucl Med Mol Imaging. 2012;2(1):110-21. Epub 2011 Dec 15. Am J Nucl Med Mol Imaging. 2012. PMID: 23133806 Free PMC article.
-
Biomarkers of Everolimus Sensitivity in Hormone Receptor-Positive Breast Cancer.J Breast Cancer. 2017 Dec;20(4):321-326. doi: 10.4048/jbc.2017.20.4.321. Epub 2017 Dec 19. J Breast Cancer. 2017. PMID: 29285035 Free PMC article. Review.
-
Identification and characterization of human leukocyte antigen class I ligands in renal cell carcinoma cells.Proteomics. 2011 Jun;11(12):2528-41. doi: 10.1002/pmic.201000486. Epub 2011 May 18. Proteomics. 2011. PMID: 21595034 Free PMC article.
-
Ten things you should know about protein kinases: IUPHAR Review 14.Br J Pharmacol. 2015 Jun;172(11):2675-700. doi: 10.1111/bph.13096. Epub 2015 Mar 24. Br J Pharmacol. 2015. PMID: 25630872 Free PMC article. Review.
References
-
- Wullschleger S, Loewith R, Hall MN. TOR signaling in growth and metabolism. Cell. 2006;124:471–484. - PubMed
-
- Bjornsti MA, Houghton PJ. The TOR pathway: a target for cancer chemotherapy. Nat Rev Cancer. 2004;4:335–348. - PubMed
-
- Lane HA, Breuleux M. Optimal targeting of the mTORC1 kinase in human cancer. Curr Opin Cell Biol. 2009;21:219–229. - PubMed
-
- Yap TA, Garrett MD, Walton MI, Raynaud F, de Bono JS, Workman P. Targeting the PI3K-AKT-mTOR pathway: progress, pitfalls, and promises. Curr Opin Pharmacol. 2008;8:393–412. - PubMed
LinkOut - more resources
Full Text Sources
Other Literature Sources
Miscellaneous