. 2010 Apr;3(2):80-90.
doi: 10.1593/tlo.09196.

KGF Promotes Paracrine Activation of the SCF/c-KIT Axis from Human Keratinocytes to Melanoma Cells

Affiliations

KGF Promotes Paracrine Activation of the SCF/c-KIT Axis from Human Keratinocytes to Melanoma Cells

Francesca Belleudi et al. Transl Oncol. 2010 Apr.

Abstract

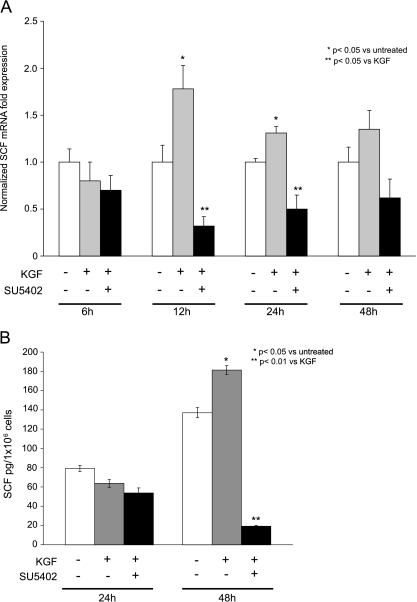
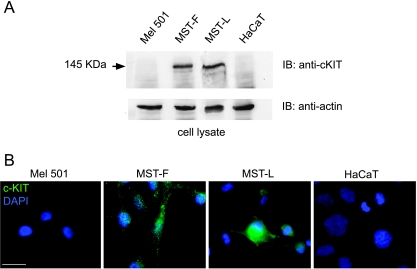
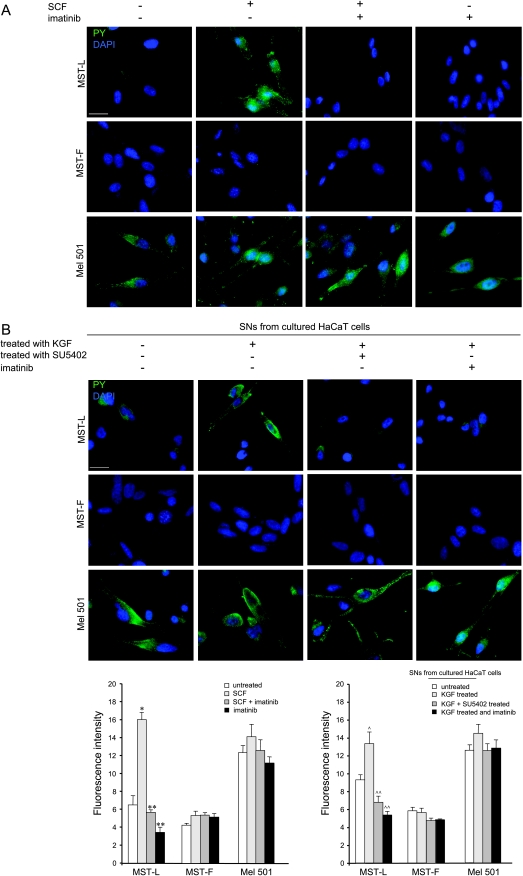
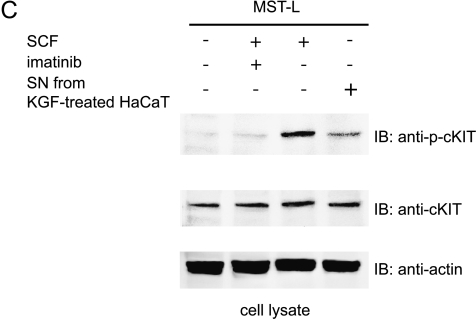
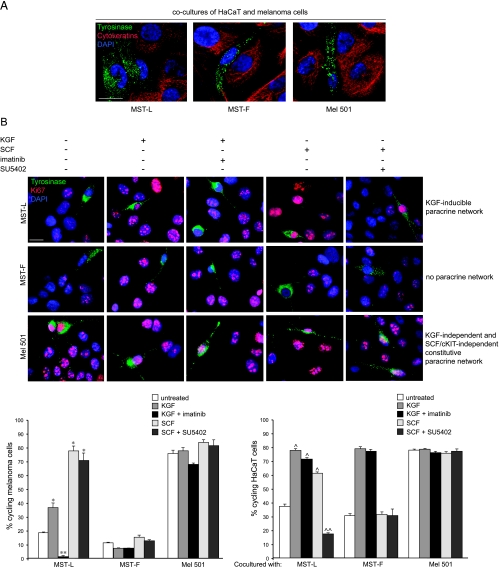
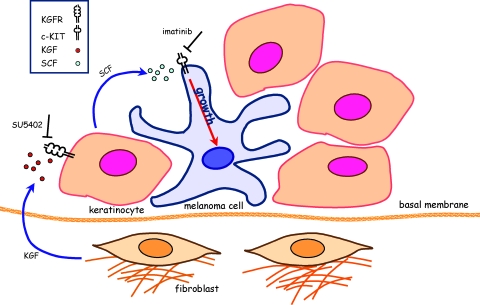
The paracrine networks of the human melanoma microenvironment are able to influence tumor growth and progression. Among the paracrine growth factors involved in skin homeostasis, the KGF/FGF7 secreted by dermal fibroblasts promotes the epidermal proliferation and differentiation as well as the release from keratinocytes of other paracrine mediators. To evaluate the possible role played by KGF in affecting the behavior of different subtypes of melanoma carrying activating mutations or overexpression of the SCF receptor c-KIT, we used human melanoma cell lines, characterized by different expression levels of c-KIT and opposing responsivity to SCF, and HaCaT keratinocytes. Quantitative real-time reverse transcription-polymerase chain reaction assay and ELISA test on KGF-treated keratinocytes showed enhanced expression and secretion of SCF in response to KGF and dependent on functional KGF receptor. Immunofluorescence microscopy and biochemical analysis showed, in one of the selected melanoma cell models, SCF-dependent c-KIT activation induced by stimulation with the culture supernatants collected from KGF-treated keratinocytes. In keratinocyte-melanoma cocultures stained for the Ki67 proliferation marker, incubation with KGF induced enhanced growth not only of the keratinocytes but also of the melanoma cells, which could be blocked by the c-KIT inhibitor imatinib, demonstrating the establishment of a KGF-induced paracrine signaling network owing to the coexpression of biologically active SCF released from keratinocytes and functional c-KIT on melanoma cells.


Figures

Figure 1
Figure 1
Expression of SCF in HaCaT cells treated with 20 ng/ml KGF for different time points (6, 12, 24, and 48 hours) in the presence or absence of the KGFR inhibitor SU5402 (25 µM). (A) Relative expression level of SCF evaluated by real-time quantitative RT-PCR. SCF/GAPDH mRNA ratio was calculated with the ΔΔCt method as described in Materials and Methods. The values of samples treated with KGF for 6, 12, 24, and 48 hours were expressed relative to untreated control samples as normalized fold expression. A significant increase in mRNA SCF expression was observed at 12 and 24 hours. Results represent the mean values ± SD from three different experiments. Student's t test was performed to evaluate significant differences. (B) SCF quantitation by ELISA assay on supernatants from HaCaT cells treated as described. The amount of SCF released in the medium resulted to be significantly increased after the treatment with KGF for 48 hours. The presence of the inhibitor SU5402 was able to revert such stimulation. Student's t test was performed to evaluate significant differences.
Figure 2
Figure 2
Different expression of c-KIT in human melanoma cell lines. (A) Mel 501, MST-F, and MST-L melanoma cells were lysed and processed for Western blot analysis using anti-c-KIT polyclonal antibodies to detect the endogenous protein: a band of 145 kDa corresponding to the molecular weight of c-KIT protein is visible in MST-F and MST-L melanoma cells but not in Mel 501 cells, and in HaCaT human keratinocytes used as negative control. Equal loading was assessed by stripping the blots and reprobing with antiactin monoclonal antibody. (B) Mel 501, MST-F, and MST-L cells and HaCaT keratinocytes were fixed, permeabilized as described in Materials and Methods, and immunolabeled with anti-c-KIT polyclonal antibodies followed by FITC-conjugated secondary antibodies. Cell nuclei were visualized by DAPI. Immunofluorescence microscopical analysis shows that in both MST-F and MST-L cells, the staining for c-KIT protein is intense and localized on the cell plasma membrane as well as in the juxtanuclear Golgi area or in small dots scattered throughout the cell periphery. In contrast, no c-KIT immunostaining is detectable in Mel 501 and HaCaT cells. Bar, 10 µm.
Figure 3
Figure 3
Tyrosine phosphorylation in melanoma cells induced by incubation with SCF or with supernatants collected from KGF-treated HaCaT cells. (A) MST-L, MST-F, and Mel 501 cells were serum-starved for 12 hours, treated with 100 ng/ml SCF for 10 minutes or preincubated for 24 hours with the c-KIT inhibitor imatinib (10 µM), and then treated with SCF as above in presence of imatinib. Cells were stained with anti-PY monoclonal antibody followed by FITC-conjugated secondary antibodies and with DAPI to visualize the cell nuclei. Quantitative immunofluorescence analysis of the fluorescence intensity, performed as described in Materials and Methods, shows in MST-L cells an increase of the phosphotyrosine staining at the cell plasma membrane induced by SCF stimulation, which is drastically reduced by pretreatment with imatinib, demonstrating that the signal is mostly due to c-KIT activation induced by the SCF ligand. Either the lowphosphotyrosine fluorescence staining observed in MST-F cells or the basal intense staining evident in Mel 501 cells does not seem modified by SCF stimulation or imatinib treatment. Bar, 10 µm. (B) MST-L, MST-F, and Mel 501 cells were serum-starved for 12 hours and treated for 10 minutes with different SNs collected from confluent cultures of HaCaT cells. Alternatively, cells were serum-starved for 12 hours, preincubated for 24 hours with imatinib, and then treated with the SNs collected from KGF-treated cells. Cells were then stained with antiphosphotyrosine monoclonal antibody. Immunofluorescence microscopical analysis and quantitative analysis of the fluorescence intensity in MST-L cells reveals an increase in the phosphotyrosine signal upon stimulation with SNs from untreated HaCaT cells and, much more, with SNs from KGF-treated HaCaT cells compared with the basal signal of serum-starved MST-L cells. The staining obtained by incubating with SNs from KGF-treated HaCaT cultures is strongly decreased by imatinib pretreatment, demonstrating that the phosphotyrosine signal is dependent on SCF present in the SN and corresponds to c-KIT activation. No significant increase in the signal is evident upon stimulation with SNs from HaCaT cells treated with KGF in the presence of the KGFR inhibitor SU5402, testifying the specificity of the KGF's effect on SCF secretion from HaCaT keratinocytes. In contrast, either the basal weak phosphotyrosine fluorescence signal observed in MST-F cells or the basal intense staining evident in Mel 501 cells does not seem to be significantly affected by stimulation with the different SNs. Bar, 10 µm. Student's t test was performed, and significance level has been defined as *P < .05 versus the corresponding untreated cells; **P < .05 versus the corresponding SCF treated cells; ^P < .05 versus the corresponding cells incubated with the SNs from untreated HaCaT cells; ^^P < .05 versus the corresponding cells incubated with the SNs from KGF-treated HaCaT cells. (C) MST-L melanoma cells were lysed and processed for Western blot analysis using anti-phospho-c-KIT and anti-c-KIT antibodies to detect the active form and the total protein: c-KIT phosphorylation is visible after incubating with SCF or with the SN from KGF-treated HaCaT cells but not in control unstimulated cells or in cells treated with SCF in the presence of imatinib. Equal loading was assessed with antiactin monoclonal antibody.
Figure 3
Figure 3
Tyrosine phosphorylation in melanoma cells induced by incubation with SCF or with supernatants collected from KGF-treated HaCaT cells. (A) MST-L, MST-F, and Mel 501 cells were serum-starved for 12 hours, treated with 100 ng/ml SCF for 10 minutes or preincubated for 24 hours with the c-KIT inhibitor imatinib (10 µM), and then treated with SCF as above in presence of imatinib. Cells were stained with anti-PY monoclonal antibody followed by FITC-conjugated secondary antibodies and with DAPI to visualize the cell nuclei. Quantitative immunofluorescence analysis of the fluorescence intensity, performed as described in Materials and Methods, shows in MST-L cells an increase of the phosphotyrosine staining at the cell plasma membrane induced by SCF stimulation, which is drastically reduced by pretreatment with imatinib, demonstrating that the signal is mostly due to c-KIT activation induced by the SCF ligand. Either the lowphosphotyrosine fluorescence staining observed in MST-F cells or the basal intense staining evident in Mel 501 cells does not seem modified by SCF stimulation or imatinib treatment. Bar, 10 µm. (B) MST-L, MST-F, and Mel 501 cells were serum-starved for 12 hours and treated for 10 minutes with different SNs collected from confluent cultures of HaCaT cells. Alternatively, cells were serum-starved for 12 hours, preincubated for 24 hours with imatinib, and then treated with the SNs collected from KGF-treated cells. Cells were then stained with antiphosphotyrosine monoclonal antibody. Immunofluorescence microscopical analysis and quantitative analysis of the fluorescence intensity in MST-L cells reveals an increase in the phosphotyrosine signal upon stimulation with SNs from untreated HaCaT cells and, much more, with SNs from KGF-treated HaCaT cells compared with the basal signal of serum-starved MST-L cells. The staining obtained by incubating with SNs from KGF-treated HaCaT cultures is strongly decreased by imatinib pretreatment, demonstrating that the phosphotyrosine signal is dependent on SCF present in the SN and corresponds to c-KIT activation. No significant increase in the signal is evident upon stimulation with SNs from HaCaT cells treated with KGF in the presence of the KGFR inhibitor SU5402, testifying the specificity of the KGF's effect on SCF secretion from HaCaT keratinocytes. In contrast, either the basal weak phosphotyrosine fluorescence signal observed in MST-F cells or the basal intense staining evident in Mel 501 cells does not seem to be significantly affected by stimulation with the different SNs. Bar, 10 µm. Student's t test was performed, and significance level has been defined as *P < .05 versus the corresponding untreated cells; **P < .05 versus the corresponding SCF treated cells; ^P < .05 versus the corresponding cells incubated with the SNs from untreated HaCaT cells; ^^P < .05 versus the corresponding cells incubated with the SNs from KGF-treated HaCaT cells. (C) MST-L melanoma cells were lysed and processed for Western blot analysis using anti-phospho-c-KIT and anti-c-KIT antibodies to detect the active form and the total protein: c-KIT phosphorylation is visible after incubating with SCF or with the SN from KGF-treated HaCaT cells but not in control unstimulated cells or in cells treated with SCF in the presence of imatinib. Equal loading was assessed with antiactin monoclonal antibody.
Figure 4
Figure 4
Proliferation of melanoma cells cocultured with HaCaT keratinocytes. Cocultures of MST-L, MST-F, or Mel 501 cells with HaCaT keratinocytes were plated at a seeding ratio of 1:20. (A) Double immunofluorescence staining was performed with anti-tyrosinase polyclonal antibodies (green) to unequivocally identify melanoma cells and with anticytokeratin monoclonal antibody (red) to recognize HaCaT keratinocytes. Cell nuclei were visualized by DAPI. The immunofluorescence analysis was performed by serial optical sectioning and three dimensional reconstruction as described in Materials and Methods. Images obtained by three-dimensional reconstruction of a selection of three of the total number of the serial optical sections are shown: the selected sequential sections are central and crossing the nucleus. The tyrosinase-positive dots corresponding to melanosomes are localized in the cytoplasm of melanoma cells, which are surrounded by HaCaT keratinocytes containing bundles of cytoplasmic keratin filaments. Bar, 10 µm. (B) Cocultured cells were serum-starved for 12 hours, treated with 20 ng/ml KGF for 48 hours or with 50 ng/ml SCF for 48 hours also in the presence of imatinib or SU5402 to inhibit c-KIT expressed on melanoma cells or KGFR expressed on HaCaT keratinocytes, respectively. Cocultures were stained with anti-Ki67monoclonal antibody (red) to detect the proliferating cells and with anti-tyrosinase polyclonal antibody (green) to identify the melanoma cells. Quantitative analysis of the percentage of cycling cells displaying the nuclear Ki67 positivity was performed as described in Materials and Methods. In cocultures of MST-L and HaCaT cells, addition of KGF causes a drastic increase in the percentage of cycling Ki67-positive nuclei in both types of cells, demonstrating that KGF is able to induce a paracrine network. Cotreatment of KGF with imatinib specifically blocks melanoma proliferation confirming the involvement of SCF release by keratinocytes in the activation of MST-L cells. Addition of SCF induces not only melanoma cell growth, as expected, but also proliferation of HaCaT keratinocytes that is selectively inhibited by cotreatment with SU5402, suggesting the possible release of KGFR ligands from melanoma cells. In cocultures of MST-F and HaCaT cells, addition of KGF causes exclusively proliferation of HaCaT cells, and incubation with SCF does not stimulate melanoma cells, revealing no induction of a paracrine network and confirming the inability of c-KIT expressed in these cells to respond to SCF. In contrast, the coculture of Mel 501 with HaCaT cells leads to the induction of a paracrine network also in untreated conditions, demonstrating that such cell-cell interaction is independent of KGF and SCF/c-KIT. Bar, 10 µm. Student's t test was performed and significance level has been defined as *P < .05 versus the corresponding untreated cells; **P < .05 versus the corresponding KGF-treated cells; ^P < .05 versus the untreated cells; ^^P < .05 versus the SCF-treated cells.
Figure 5
Figure 5
Schematic drawing of the proposed KGF-dependent paracrine SCF/c-KIT axis from keratinocytes to melanoma cells: KGF secreted by dermal fibroblasts binds to KGFR exposed on epidermal keratinocytes, which, in turn, produce SCF. Through binding to functional c-KIT expressed on melanoma cells, SCF stimulates tumor cell growth.

Similar articles

Cited by

References

    1. Chin L, Garraway LA, Fisher DE. Malignant melanoma: genetics and therapeutics in the genomic era. Genes Dev. 2006;20:2149–2182. - PubMed
    1. Zaidi MR, Day CP, Merlino G. From UV to metastases: modeling melanoma initiation and progression in the mouse. J Invest Dermatol. 2008;128:2381–2391. - PubMed
    1. Curtin JA, Fridlyand J, Kageshita T, Patel HN, Busam KJ, Kutzner H, Cho KH, Aiba S, Bröcker EB, LeBoit PE, et al. Distinct sets of genetic alterations in melanoma. N Engl J Med. 2005;353:2135–2147. - PubMed
    1. Goel VK, Lazar AJ, Warneke CL, Redston MS, Haluska FG. Examination of mutations in BRAF, NRAS, and PTEN in primary cutaneous melanoma. J Invest Dermatol. 2006;126:154–160. - PubMed
    1. Muthusamy V, Hobbs C, Nogueira C, Cordon-Cardo C, McKee PH, Chin L, Bosenberg MW. Amplification of CDK4 and MDM2 in malignant melanoma. Genes Chromosomes Cancer. 2006;45:447–454. - PubMed

LinkOut - more resources