. 2010 Apr;12(4):294-304.
doi: 10.1593/neo.91930.

The extracellular matrix glycoprotein elastin microfibril interface located protein 2: a dual role in the tumor microenvironment

Affiliations

The extracellular matrix glycoprotein elastin microfibril interface located protein 2: a dual role in the tumor microenvironment

Maurizio Mongiat et al. Neoplasia. 2010 Apr.

Abstract

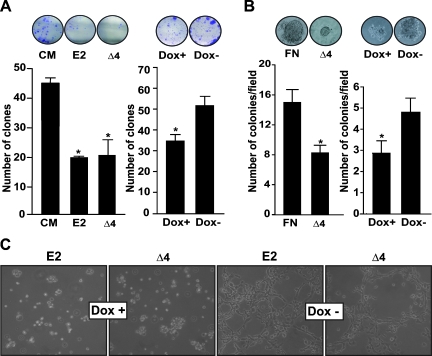
We have recently reported that elastin microfibril interface located protein 2 (EMILIN2), an extracellular matrix (ECM) glycoprotein, triggers cell death through a direct binding to death receptors. EMILIN2 thus influences cell viability through a mechanism that is unique for an ECM molecule. In the present work, we report an additional function for this molecule. First, we identify the region responsible for the proapoptotic effects, a 90-amino acid residue-long coiled-coil fragment toward the N-terminus of the molecule. The fragment recapitulates EMILIN2 proapoptotic mechanisms. In addition, using either the full molecule or the active fragment, for the first time, we demonstrate a significant antitumoral effect in vivo, likely due to a decrease in tumor cell viability. Unexpectedly, tumors treated with EMILIN2 or the deletion mutant display a significant increase of tumor angiogenesis. In view of this novel finding, the cotreatment of the growing tumors with an antiangiogenic drug led, in most cases, to a complete regression of tumor growth. These results grant further support to recent findings that pinpoint the microenvironment as an important regulator of cell fate under both physiological and pathological conditions and disclose the possibility of using EMILIN2 fragments as potent antineoplastic tools for cancer treatment.


Figures

Figure 1
Figure 1
EMILIN2 induces apoptosis of tumor cells, leaving normal cells unharmed. (A) Top panel: Western blot analysis of EMILIN2 expression after transduction of HT1080 cells with the adenoviral construct with or without doxycycline (Dox+ and Dox-). Bottom panel: MTT assay after transduction. Right panels: Representative pictures of HT1080 cells undergoing apoptosis after overexpression of EMILIN2. Bar, 75 µm. (B) MTT assays performed on HT1080 cells after treatment with 293-EBNA conditioned media in the presence or absence of EMILIN1 or EMILIN2 (E1, E2, and CM, respectively) or with purified Multimerin2 [33] or fibronectin (MMRN2 and FN, respectively). (C) TUNEL assay performed on HT1080 cells transduced with the EMILIN2 adenoviral construct with or without doxycycline. (D) Top panel: Western blot on NHDF-Ad cells transduced with the EMILIN2 adenoviral construct with or without doxycycline. Bottom panel: Relative MTT assay. Representative pictures of the cells are on the right panels. Bar, 75 µm. *P ≤ .02.
Figure 2
Figure 2
The EMILIN2 proapoptotic effects are recapitulated by a 90-amino acid residue region. (A) Schematic representation of EMILIN2 (E2) and the deletion mutants (Δ1 to Δ4). The position of the amino acid residues delimiting the domains is reported at the top; those corresponding to the deletions are at the bottom. Blue indicates EMI domain; yellow, coiled-coil region; magenta, proline-rich domain; red, collagenous stalk; and light blue, gC1q domain. (B) Western blot analysis of the conditioned media from 293-EBNA cells transfected with the EMILIN2 (E2), the various EMILIN2 deletions (Δ1 to Δ4), or TRAIL (T) constructs. An a-His antibody was used for the analysis, and conditioned medium from mock-transfected cells was used as a control (CM). (C) MTT assay performed on HT1080 cells challenged with recombinant EMILIN2 (E2), the deletion mutants (Δ1 to Δ4), or TRAIL (T). Conditioned medium (CM) from mock-transfected cells was used as control. (D) TUNEL assay performed on HT1080 cells after treatment with EMILIN2 (E2), Δ4 (Δ4), TRAIL (T), or fibronectin (FN) as a control. Data are representative of three independent experiments. *P ≤ .03.
Figure 3
Figure 3
Δ4 induces tumor cell apoptosis through direct binding to death receptor DR4. (A) Top left panel: Western blot analysis of conditioned media from HT1080 cells transduced with the Δ4 adenoviral vector with or without doxycycline (Dox+ and Dox-, respectively). Bottom left graph: MTT assay performed on HT1080 cells. Right panels: Representative image. Bar, 75 µm. (B) TUNEL assay performed on Δ4-transduced HT1080 cells with or without doxycycline (Dox+ and Dox-, respectively). (C) GST pull-down experiment using the DR4 extracellular region fused to the GST protein incubated with TRAIL, EMILIN2, or the Δ1 and Δ4 deletion mutants (T, E2, Δ1, and Δ4, respectively). (D) Top panel: DISC immunoprecipitation after incubating HeLa cells with type I collagen, TRAIL, EMILIN2, or Δ4 (C I, T, E2, and Δ4, respectively). Immunoprecipitates were analyzed with the α-type I collagen, the α-DR4, the α-caspase-8, and the α-FADD antibodies or with α-FLAG antibody to detect EMILIN2, Δ4, or TRAIL, as indicated on the right side of the panels. Bottom panel: Western blot analysis of caspase-8 and -3 activation showing significant decrease of the uncleaved forms after treatment with EMILIN2 and Δ4 conditioned media (E2 and Δ4, respectively). Conditioned medium (CM) from mock-transfected cells was used as control and vinculin was used as normalizer of protein loading. (E) Right panels: Immunofluorescence analysis of caspase-8 activation after treating HT1080 cells with Δ4 (Δ4); fibronectin and staurosporin (FN and St) were used as negative and positive controls, respectively. Left panels: Nuclei were stained with Hoechst stain. Bar, 20 µm. (F) Left panel: ELISA-based TUNEL assay performed on HT1080 cells transfected with a dominant-negative DR4 or with empty vector (tDR4 or mock, respectively) and challenged with Δ4. Right panel: Schematic representation of the DR4 deletion mutant. *P ≤ .03.
Figure 4
Figure 4
The Δ4 deletion mutant exerts an antitumoral effect in vitro. (A) Clonogenic assay performed on HT1080 cells treated with mock, EMILIN2, or Δ4 conditioned media (CM, E2, and Δ4, respectively; left panel) or after transduction with the Δ4 adenoviral vector, with or without doxycycline (Dox+ and Dox-, respectively; right panel). Top panel: Representative pictures. (B) Soft agar colony assay performed on HT1080 cells challenged with Δ4 or fibronectin (Δ4 and FN, respectively; left panel) or after transduction with the Δ4 adenoviral vector, with or without doxycycline (Dox+ and Dox-, respectively; right panel). Top panel: Representative pictures. (C) Matrigel-included HT1080 cells transduced with the EMILIN2 or Δ4 adenoviral constructs (E2 and Δ4, respectively) with or without doxycycline (Dox+ and Dox-, respectively). Bar, 75 µm; *P ≤ .05.
Figure 5
Figure 5
The Δ4 deletion mutant affects tumor growth in vivo. (A) In vivo imaging analysis of fluorescently labeled HT1080 tumors treated every other day with PBS or recombinant EMILIN2 (CTRL or pE2, respectively). (B) In vivo imaging analysis of luminescent HT1080 cells transduced with control (CTRL) or EMILIN2 (Ad-E2) adenoviral constructs and injected in the left or right flank of nude mice, respectively. (C) In vivo imaging analysis of fluorescently labeled HT1080 tumors treated every other day with PBS or recombinant Δ3 (CTRL or Δ3, respectively). (D) In vivo imaging analysis of luminescent HT1080 cells transduced with control adenoviral vector (CRTL) or Δ4 construct (Ad-E2 Δ4) and injected in the left and right flank of nude mice, respectively. *P ≤ .04.
Figure 6
Figure 6
The EMILIN2 antitumoral effects hinge on its proapoptotic effects and are enhanced by antiangiogenic combined therapy. (A) Top panels: Representative pictures of the TUNEL assay performed on sections from tumors treated with PBS, EMILIN2, or Δ4. Bottom graph: Evaluation of tumor cell apoptotic rate. Bar, 20 µm. (B) Caspase-8 and caspase-3/7 activity in tumors from HT1080 cells transduced with the EMILIN2 or Δ4 constructs or empty vector (Ad-E2, Δ4 and CTRL, respectively), as detected by the caspase-Glo assays (top and bottom panels, respectively). Three random tumor samples were chosen. (C) Top panels: Tumor blood vessels immunostaining after treatment with PBS, purified EMILIN2, or Δ4 (CTRL, pE2Δ4, and pE2, respectively). Bottom graph: Evaluation of the vessel density on 10 independent fields was performed with the Image Tool Software. Bar, 75 µm. (D) Tumor blood vessels immunostaining treatment with bevacizumab, Δ4, or Δ4 plus bevacizumab (CTRL, BEVA, pE2Δ4, and pE2Δ4 + BEVA, respectively). Left bottom graph: Evaluation of the vessel density. Bottom right graph: Tumor volume evaluation after injection of HT1080 cells and treatment with PBS, bevacizumab, Δ4, or Δ4 plus bevacizumab (CTRL, BEVA, pE2Δ4, and pE2Δ4 + BEVA, respectively). Bar, 75 µm. The values represent the mean ± SE of 10 tumors per point. *P ≤ .04, xP ≤ .03, between control and treated tumors; ✦ P ≤ .02, between bevacizumab only and bevacizumab plus Δ4.
Figure 7
Figure 7
EMILIN2 affects EC proliferation and migration. (A) Pictures taken at four time intervals during in vitro tubulogenesis on Matrigel after treatment with 2.5 µg/ml of recombinant EMILIN2 or Δ4; PBS was used as a control (pE2, pE2Δ4, and PBS, respectively). Bar, 75 µm. (B) Top graph: MTT assay performed on HUVECs treated with PBS, Δ4, or EMILIN2 (CTRL, pE2Δ4, and pE2, respectively). Bottom graph: Number of HUVEC migrated cells after transwell membrane coating with 10 µg/ml of denatured BSA, recombinant EMILIN2, or type I collagen (BSA, pE2, and Coll I, respectively). Cells were counted in 10 fields each. (C) Scratch test performed on HUVECs treated with 10 µg/ml of recombinant EMILIN2 or type I collagen (pE2 and Coll I, respectively). Pictures were obtained at different time intervals. Bar, 75 µm. (D) The percentage of cell migration was extrapolated by measuring the area of the scratch covered by the migrating cells by means of the Image Tool Software. Results represent the mean ± SD of three independent experiments. *P ≤ .04.

Similar articles

Cited by

References

    1. Kalluri R, Zeisberg M. Fibroblasts in cancer. Nat Rev Cancer. 2006;6:392–401. - PubMed
    1. Sund M, Kalluri R. Tumor stroma derived biomarkers in cancer. Cancer Metastasis Rev. 2009;28:177–183. - PMC - PubMed
    1. Geiger TR, Peeper DS. Metastasis mechanisms. Biochim Biophys Acta. 2009;1796:293–308. - PubMed
    1. Folkman J. Tumor angiogenesis: therapeutic implications. N Engl J Med. 1971;285:1182–1186. - PubMed
    1. Thompson Coon JS, Liu Z, Hoyle M, Rogers G, Green C, Moxham T, Welch K, Stein K. Sunitinib and bevacizumab for first-line treatment of metastatic renal cell carcinoma: a systematic review and indirect comparison of clinical effectiveness. Br J Cancer. 2009;101:238–243. - PMC - PubMed

Supplementary References

    1. Cha SS, Kim MS, Choi YH, Sung BJ, Shin NK, Shin HC, Sung YC, Oh BH. 2.8 A resolution crystal structure of human TRAIL, a cytokine with selective antitumor activity. Immunity. 1999;11:253–261. - PubMed
    1. Mongiat M, Mungiguerra G, Bot S, Mucignat MT, Giacomello E, Doliana R, Colombatti A. Self-assembly and supramolecular organization of EMILIN. J Biol Chem. 2000;275:25471–25480. - PubMed
    1. Mongkolsapaya J, Grimes JM, Chen N, Xu XN, Stuart DI, Jones EY, Screaton GR. Structure of the TRAIL-DR5 complex reveals mechanisms conferring specificity in apoptotic initiation. Nat Struct Biol. 1999;6:1048–1053. - PubMed

Publication types

MeSH terms

LinkOut - more resources