. 2010 Mar 31;5(3):e9883.
doi: 10.1371/journal.pone.0009883.

Delimiting species without nuclear monophyly in Madagascar's mouse lemurs

Affiliations

Delimiting species without nuclear monophyly in Madagascar's mouse lemurs

David W Weisrock et al. PLoS One. .

Abstract

Background: Speciation begins when populations become genetically separated through a substantial reduction in gene flow, and it is at this point that a genetically cohesive set of populations attain the sole property of species: the independent evolution of a population-level lineage. The comprehensive delimitation of species within biodiversity hotspots, regardless of their level of divergence, is important for understanding the factors that drive the diversification of biota and for identifying them as targets for conservation. However, delimiting recently diverged species is challenging due to insufficient time for the differential evolution of characters--including morphological differences, reproductive isolation, and gene tree monophyly--that are typically used as evidence for separately evolving lineages.

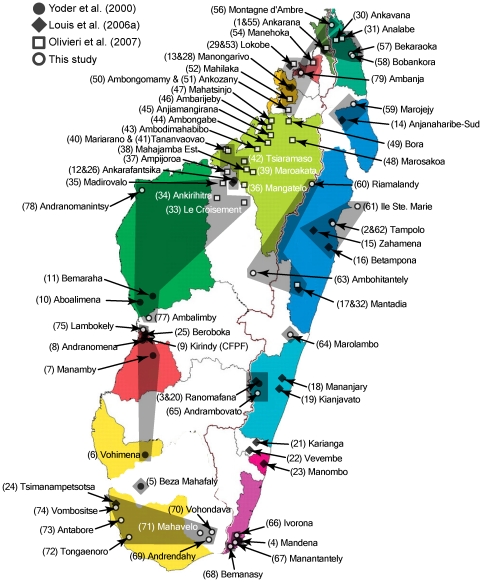
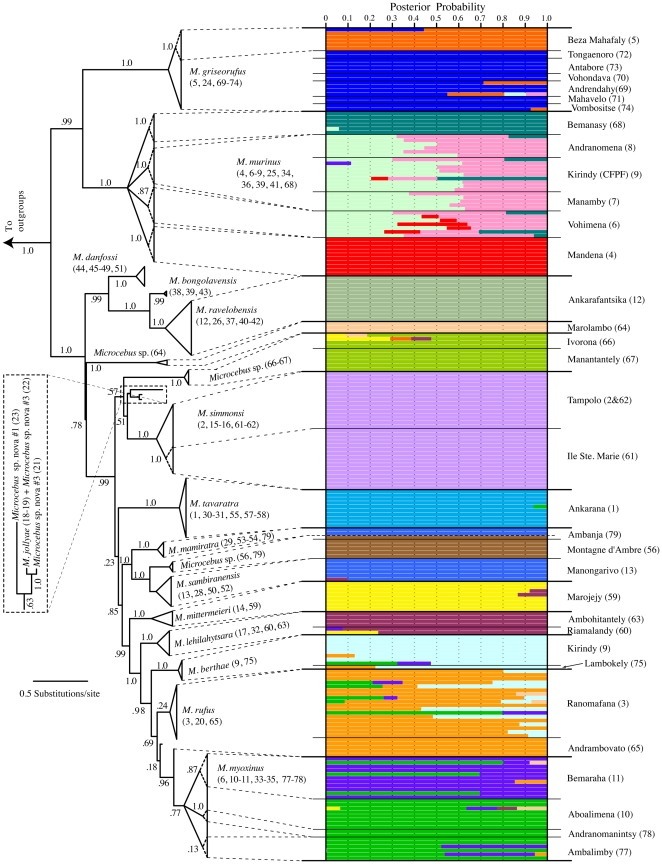
Methodology: In this study, we assembled multiple lines of evidence from the analysis of mtDNA and nDNA sequence data for the delimitation of a high diversity of cryptically diverged population-level mouse lemur lineages across the island of Madagascar. Our study uses a multi-faceted approach that applies phylogenetic, population genetic, and genealogical analysis for recognizing lineage diversity and presents the most thoroughly sampled species delimitation of mouse lemur ever performed.

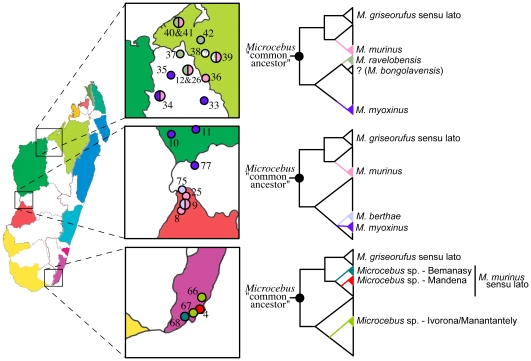
Conclusions: The resolution of a large number of geographically defined clades in the mtDNA gene tree provides strong initial evidence for recognizing a high diversity of population-level lineages in mouse lemurs. We find additional support for lineage recognition in the striking concordance between mtDNA clades and patterns of nuclear population structure. Lineages identified using these two sources of evidence also exhibit patterns of population divergence according to genealogical exclusivity estimates. Mouse lemur lineage diversity is reflected in both a geographically fine-scaled pattern of population divergence within established and geographically widespread taxa, as well as newly resolved patterns of micro-endemism revealed through expanded field sampling into previously poorly and well-sampled regions.


Conflict of interest statement

Competing Interests: The authors have declared that no competing interests exist.

Figures

Figure 1
Figure 1. The geographic positions for sampled Microcebus localities presented in this study.
Numbers in parentheses refer to a detailed listing of localities found in Table S1. Localities marked with an open circle are new to this study and are represented with mtDNA and nDNA data. Localities marked with a filled circle are from Yoder et al. (2000) and Heckman et al. and are represented by mtDNA and nDNA sequence data. Localities marked with filled diamonds and open squares are from Louis et al. and Olivieri et al. , respectively, and are represented only by mtDNA data. The island is broken up into regions of micro-endemism (colored sections) and retreat-dispersion (outlined white sections) as defined by Wilmé et al. . Shaded polygons overlay the known distribution of lineages resolved in this study. Localities not encompassed by a shaded polygon are represented by a mtDNA clade that cannot be linked to a nuclear genotypic cluster, limiting a full species delimitation assessment. Due to the extensive overlap of M. murinus with other lineages across the western portion of the island, its full range is not depicted.
Figure 2
Figure 2. Correspondence between clades in the mtDNA gene tree and nuclear Structure clusters.
The mtDNA gene tree results from Bayesian analysis of concatenated cox2 and cytb sequence. It is presented as a maximum credibility topology with branch lengths averaged across the posterior distribution. Numbers on branches represent posterior probabilities. Relationships within terminal clades are collapsed for ease of presentation and clades are labeled according to present species designations. Locality numbers are given in parentheses and correspond to Fig. 1 and Table S1. Clades are mapped to corresponding clusters in the nuclear STRUCTURE plot. Each cluster is designated by a different color with horizontal bars representing individuals and the proportion of a bar assigned to a single color representing the posterior probability that an individual is assigned to that cluster. This can also be interpreted as the percentage of an individuals genome that is derived from that particular genetic cluster. Localities from which individuals are sampled from are given along the right side of the plot. MtDNA clades not mapped to the assignment plot represent individuals for which corresponding nDNA data is not available. The colors in the Bayesian assignment plot do not correspond to colored areas of micro-endemism in Fig. 1.
Figure 3
Figure 3. Phylogenetic descriptions of areas of sympatry and fine-scale allopatry among Microcebus lineages.
Colored sections in the maps of Madagascar signify areas of micro-endemism and white sections signify retreat dispersion regions . All known regions of sympatry in mouse lemurs involve populations of M. murinus sensu lato. The top two outlined boxes highlight regions of sympatry involving M. murinus and at least three other species (M. bongolavensis could not be assessed in this study), each of which shares a most recent common ancestor with M. murinus at the root of most gene trees. However, at least one case of sympatry is known that involves M. murinus and its sister lineage, M. griseorufus, in the Berenty Reserve in southern Madagascar [not sampled in this study and not depicted here . As further support for the speciation model of Wilmé et al. (2006), areas of sympatry appear to be clustered in or near retreat dispersion regions, which are proposed to have influenced the expansion of species ranges during the Quaternary. In contrast, the bottom outlined box highlights lineage distributions within a single region of micro-endemism in the southeast.

References

    1. de Queiroz K. The general lineage concept of species, species criteria, and the process of speciation: a conceptual unification and terminological recommendations. In: Howard DJ, Berlocher SH, editors. Endless forms: species and speciation. Oxford: Oxford University Press; 1998. pp. 57–75.
    1. Mayden RL. The denouement in the saga of the species problem. In: Claridge MF, Dawah HA, Wilson MR, editors. Species: The units of biodiversity. London: Chapman and Hall; 1997. pp. 381–424.
    1. de Queiroz K. The general lineage concept of species and the defining properties of the species category. In: Wilson RA, editor. Species: New Interdisciplinary Essays. Cambridge, , MA: MIT Press; 1999. pp. 49–89.
    1. Mayden RL. Consilience and a hierarchy of species concepts: advances toward closure on the species puzzle. J Nematol. 1999;31:95–116. - PMC - PubMed
    1. de Queiroz K. Species concepts and species delimitation. Syst Biol. 2007;56:879–886. - PubMed

Publication types