Phase Behavior of Planar Supported Lipid Membranes Composed of Cholesterol and 1,2-Distearoyl-sn-Glycerol-3-Phosphocholine Examined by Sum-Frequency Vibrational Spectroscopy
- PMID: 20361007
- PMCID: PMC2846528
- DOI: 10.1016/j.vibspec.2008.09.004
Phase Behavior of Planar Supported Lipid Membranes Composed of Cholesterol and 1,2-Distearoyl-sn-Glycerol-3-Phosphocholine Examined by Sum-Frequency Vibrational Spectroscopy
Abstract
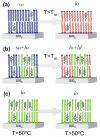
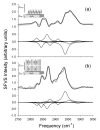
The influence of cholesterol (CHO) on the phase behavior of 1,2-distearoyl-sn-glycero-3-phosphocholine (DSPC) planar supported lipid bilayers (PSLBs) was investigated by sum-frequency vibrational spectroscopy (SFVS). The intrinsic symmetry constraints of SFVS were exploited to measure the asymmetric distribution of phase segregated phospholipid domains in the proximal and distal layers of DSPC + CHO binary mixtures as a function of CHO content and temperature. The SFVS results suggest that cholesterol significantly affects the phase segregation and domain distribution in PSLBs of DSPC in a concentration dependent manner, similar to that found in bulk suspensions. The SFVS spectroscopic measurements of phase segregation and structure change in the binary mixture indicate that membrane asymmetry must be present in order for the changes in SFVS signal to be observed. These results therefore provide important evidence for the delocalization and segregation of different phase domain structures in PSLBs due to the interaction of cholesterol and phospholipids.
Figures

Similar articles
-
The effect of cholesterol on the intrinsic rate of lipid flip-flop as measured by sum-frequency vibrational spectroscopy.Faraday Discuss. 2013;161:45-61; discussion 113-50. doi: 10.1039/c2fd20083j. Faraday Discuss. 2013. PMID: 23805737
-
A correlation between lipid domain shape and binary phospholipid mixture composition in free standing bilayers: A two-photon fluorescence microscopy study.Biophys J. 2000 Jul;79(1):434-47. doi: 10.1016/S0006-3495(00)76305-3. Biophys J. 2000. PMID: 10866969 Free PMC article.
-
Direct measurement of the transbilayer movement of phospholipids by sum-frequency vibrational spectroscopy.J Am Chem Soc. 2004 Jul 14;126(27):8376-7. doi: 10.1021/ja048245p. J Am Chem Soc. 2004. PMID: 15237984
-
Sum-frequency vibrational spectroscopy, a tutorial: Applications for the study of lipid membrane structure and dynamics.Biointerphases. 2024 May 1;19(3):031201. doi: 10.1116/6.0003594. Biointerphases. 2024. PMID: 38738942 Review.
-
Phase separation in lipid membranes.Cold Spring Harb Perspect Biol. 2011 Apr 1;3(4):a004630. doi: 10.1101/cshperspect.a004630. Cold Spring Harb Perspect Biol. 2011. PMID: 21441593 Free PMC article. Review.
Cited by
-
A simplified sum-frequency vibrational imaging setup used for imaging lipid bilayer arrays.Anal Chem. 2012 Oct 2;84(19):8122-6. doi: 10.1021/ac301290e. Epub 2012 Sep 14. Anal Chem. 2012. PMID: 22947074 Free PMC article.
-
Does vitamin E behave like cholesterol? An examination of vitamin E's effects on phospholipid membrane structure and dynamics through sum-frequency vibrational spectroscopy.Biophys J. 2025 Apr 15;124(8):1226-1244. doi: 10.1016/j.bpj.2025.02.028. Epub 2025 Mar 6. Biophys J. 2025. PMID: 40055893
-
Protein-phospholipid interactions in nonclassical protein secretion: problem and methods of study.Int J Mol Sci. 2013 Feb 8;14(2):3734-72. doi: 10.3390/ijms14023734. Int J Mol Sci. 2013. PMID: 23396106 Free PMC article.
References
-
- Demel RA, De Kruyff B. Biochimica et Biophysica Acta, Reviews on Biomembranes. 1976;457:109–32. - PubMed
-
- Gennis RB. Biomembranes: Molecular Structure and Function. Springer-Verlag; New York: 1989.
-
- Alberts B, Alexander J, Lewis J, Raff M, Roberts K, Walter P. Molecular Biology of the Cell, 4th Edition. 2004
-
- Presti FT. Membr Fluid Biol. 1985;4:97–146.
-
- Ipsen JH, Karlstroem G, Mouritsen OG, Wennerstroem H, Zuckermann MJ. Biochimica et Biophysica Acta. 1987;905:162–72. - PubMed
Grants and funding
LinkOut - more resources
Full Text Sources
