Review
. 2010 Jul;53(7):1270-87.
doi: 10.1007/s00125-010-1684-1. Epub 2010 Apr 2.

Insulin resistance, lipotoxicity, type 2 diabetes and atherosclerosis: the missing links. The Claude Bernard Lecture 2009

Affiliations
Review

Insulin resistance, lipotoxicity, type 2 diabetes and atherosclerosis: the missing links. The Claude Bernard Lecture 2009

R A DeFronzo. Diabetologia. 2010 Jul.

Abstract

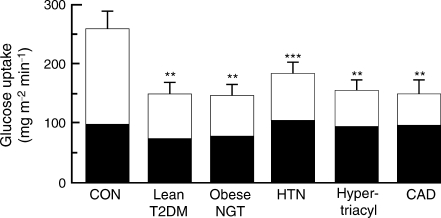
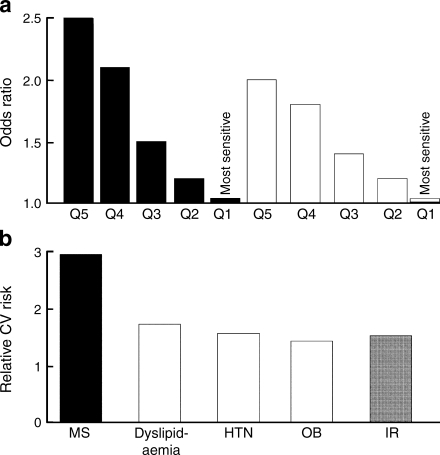
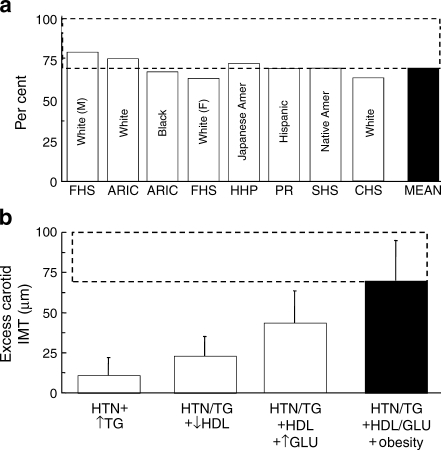
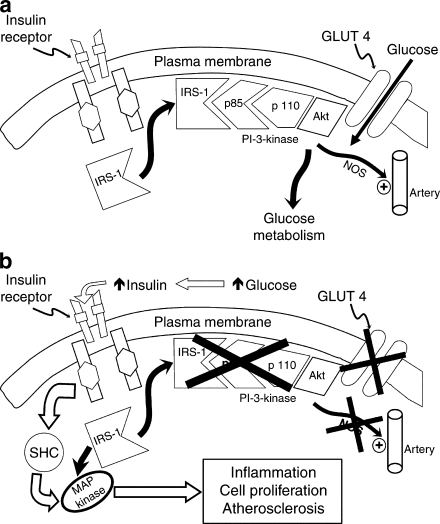
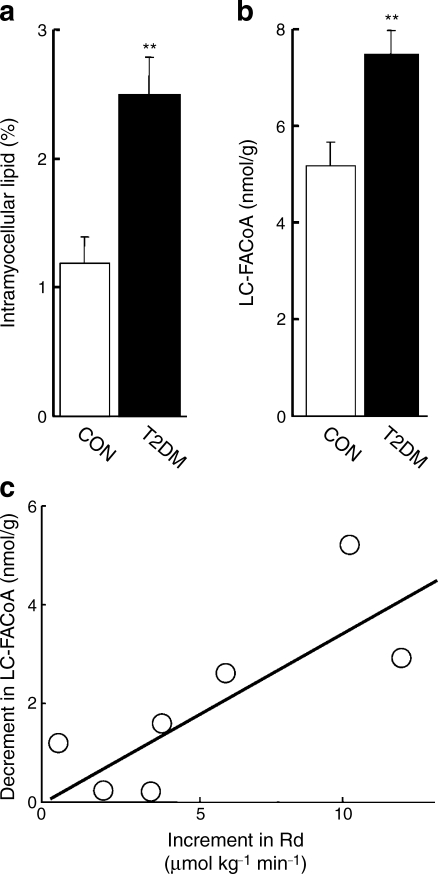
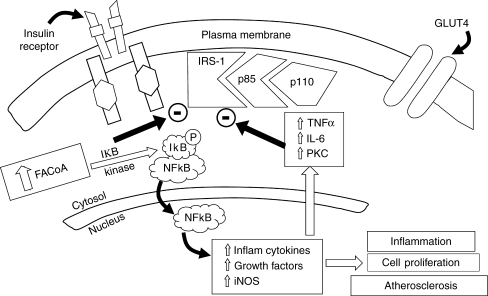
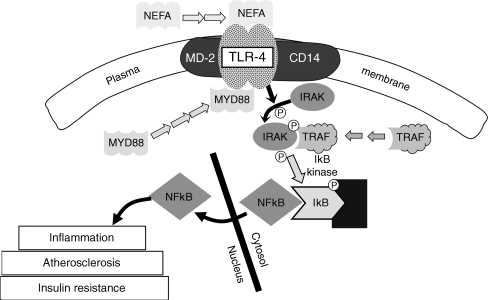
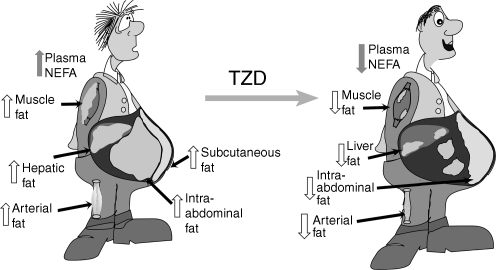
Insulin resistance is a hallmark of type 2 diabetes mellitus and is associated with a metabolic and cardiovascular cluster of disorders (dyslipidaemia, hypertension, obesity [especially visceral], glucose intolerance, endothelial dysfunction), each of which is an independent risk factor for cardiovascular disease (CVD). Multiple prospective studies have documented an association between insulin resistance and accelerated CVD in patients with type 2 diabetes, as well as in non-diabetic individuals. The molecular causes of insulin resistance, i.e. impaired insulin signalling through the phosphoinositol-3 kinase pathway with intact signalling through the mitogen-activated protein kinase pathway, are responsible for the impairment in insulin-stimulated glucose metabolism and contribute to the accelerated rate of CVD in type 2 diabetes patients. The current epidemic of diabetes is being driven by the obesity epidemic, which represents a state of tissue fat overload. Accumulation of toxic lipid metabolites (fatty acyl CoA, diacylglycerol, ceramide) in muscle, liver, adipocytes, beta cells and arterial tissues contributes to insulin resistance, beta cell dysfunction and accelerated atherosclerosis, respectively, in type 2 diabetes. Treatment with thiazolidinediones mobilises fat out of tissues, leading to enhanced insulin sensitivity, improved beta cell function and decreased atherogenesis. Insulin resistance and lipotoxicity represent the missing links (beyond the classical cardiovascular risk factors) that help explain the accelerated rate of CVD in type 2 diabetic patients.


Figures

Fig. 1
Fig. 1
Insulin-stimulated glucose disposal (40 mU m−2 min−1, euglycaemic–hyperinsulaemic clamp) in lean healthy control (CON) participants, obese normal-glucose-tolerant participants (NGT), lean drug-naive type 2 diabetic participants (T2DM), lean normal-glucose-tolerant hypertensive participants (HTN), NGT hypertriacylglycerolaemic (Hypertriacyl) participants and non-diabetic participants with coronary artery disease (CAD). White sections, non-oxidative glucose disposal (glycogen synthesis); black sections, glucose oxidation. **p < 0.01 vs CON; ***p < 0.001 vs CON. Figure adapted with permission from Kashyap et al. [19] and DeFronzo et al. [20]. To change glucose uptake into SI units, divide by 180
Fig. 2
Fig. 2
a Association between insulin resistance (HOMA-IR) and 8-year incidence of CVD in non-diabetic participants in the San Antonio Heart Study before (black bars) and after (white bars) adjustment for age, sex, blood pressure, plasma lipids, smoking, exercise and waist circumference. Events, n = 187, participants, n = 2,569. Panel adapted with permission from Hanley et al. [67]. b Bar graph of 6.9 year risk of CVD in 3,606 participants with the metabolic syndrome (MS) and with individual components of the metabolic syndrome, i.e. dyslipidaemia (Dyslip), hypertension (HTN), obesity (OB) and insulin resistance (IR, highest HOMA quartile) in the Botnia Study. Panel adapted with permission from Isomaa et al. [68]
Fig. 3
Fig. 3
a Predictive value (%) of CVD using the Framingham risk engine in Framingham Heart Study (FHS), the Atherosclerosis Risk in Community Study (ARIC), the Honolulu Heart Program (HHP), the Puerto Rico Heart Health Program (PR), the Strong Heart Study (SHS) and the Cardiovascular Health Study (CHS). On mean, the Framingham Risk engine predicts only 69% of the risk of a future cardiovascular event. Panel adapted with permission from D’Agostino et al. [74]. b Excess carotid intima–media thickness (IMT) in relation to the individual components of the insulin resistance (metabolic) syndrome as listed. Amer, American; HTN, hypertension; F, female; M, male; TG, triacylglycerol; GLU, glucose. Fields in dotted lines, unexplained risk (a 31%; b, 30%). Panel adapted with permission from Goldsen et al. [76]
Fig. 4
Fig. 4
a Insulin signal transduction system in individuals with normal glucose tolerance (see text for a detailed discussion). NOS, nitric oxide synthase. b In type 2 diabetic participants insulin signalling is impaired at the level of IRS-1 leading to decreased glucose transport/phosphorylation/metabolism and impaired nitric oxide synthase activation/endothelial function. At the same time, insulin signalling through the MAP kinase pathway is normally sensitive to insulin. The compensatory hyperinsulinaemia (due to insulin resistance in the IRS-1/PI-3 kinase pathway) results in excessive stimulation of this pathway, which is involved in inflammation, cell proliferation and atherogenesis (see text for a detailed discussion). SHC, Src homology collagen. Reproduced from DeFronzo [1]
Fig. 5
Fig. 5
a Intramyocellular lipid content (measured by magnetic resonance spectroscopy) and (b) muscle long-chain fatty acyl CoA (LC-FACoA) content in control (CON) and type 2 diabetic (T2DM) participants. **p < 0.01 for T2DM vs CON. c Relationship between the increment in insulin-stimulated rate of glucose disposal (Rd) and decrement in muscle LC-FACoA content in type 2 diabetic participants after treatment with acipimox. p < 0.01; r = 0.74. Figure adapted with permission from Bajaj et al. [143]
Fig. 6
Fig. 6
Relationship between intracellular fatty acyl CoA levels, IkB/NFkB and the insulin signal transduction pathway (see text for a detailed discussion). iNOS, inducible nitric oxide synthase
Fig. 7
Fig. 7
Schematic representation of the toll-like receptor 4 (TLR-4) pathway and its activation by NEFA. Dissociation of NFkB from IkB allows it to diffuse into the nucleus where it can turn on genes associated with inflammation, atherosclerosis and insulin resistance (see text for a detailed discussion). CD14, cluster of differentiation 14; IRAK, interleukin-1 receptor associated kinase, MD-2, myb regulated gene; MYD88, myeloid differentiation primary response gene; TRAF, TNFa receptor associated factor
Fig. 8
Fig. 8
Fat topography in type 2 diabetes and effect of thiazolidine-diones (TZD) (see text for a detailed discussion)
Fig. 9
Fig. 9
Rosiglitazone (ROSI) treatment of type 2 diabetic patients (T2DM) for 4 months markedly augmented insulin signalling through the IRS-1/PI-3 kinase pathway without altering (a) insulin receptor tyrosine phosphorylation, (b) IRS-1 tyrosine phosphorylation, (c) association of p85 subunit of PI-3 kinase with IRS-1 and (d) association of PI-3 kinase with IRS-1. *p < 0.05; **p < 0.01. Figure adapted with permission from Miyazaki et al. [126]
Fig. 10
Fig. 10
PGC-1α and PGC-1β expression in muscle of (a, b) individuals with normal-glucose-tolerance and without family history (FH−) of diabetes, insulin-resistant normal-glucose-tolerant offspring of two type 2 diabetic parents (FH+) and participants with type 2 diabetes mellitus (T2DM). c A strong linear relationship exists between PGC-1α mRNA and PDHA1 mRNA, and the expression of other mitochondrial genes (not shown) involved in oxidative phosphorylation. White diamonds, FH−; black triangles, type 2 diabetes mellitus; hatched squares, FH+. d, e Pioglitazone (PIO) treatment of type 2 diabetic patients significantly increased the expression of PGC-1α and PGC-1β mRNA in muscle. *p < 0.05 for FH + vs FH−; **p < 0.01 for FH+ and T2DM vs FH−, and (d, e) *p < 0.05 for PIO vs Basal. Figure adapted with permission from Patti et al. [182] and Coletta et al. [175]
Fig. 11
Fig. 11
Amelioration of lipotoxicity by action of pioglitazone in increasing the plasma adiponectin concentration and levels of adiponectin receptors (ADIPOR) 1 and 2. See text for a detailed discussion. ACC, acetyl CoA carboxylase; CPT-1, carnitine palmitoyl transferase-1; CREB, cAMP response element binding; DAG, diacylglycerol; MEF2C, myocyte enhancer factor 2C. Figure adapted with permission from Civitarese et al. [187] and Coletta et al. [175]

References

    1. DeFronzo RA. From the triumvirate to the ominous octet: a new paradigm for the treatment of type 2 diabetes mellitus. Diabetes. 2009;58:773–795. - PMC - PubMed
    1. Diabetes Control and Complications Trial Research Group The effect of intensive treatment of diabetes on the development and progression of long-term complications in insulin-dependent diabetes mellitus. N Engl J Med. 1993;329:977–986. - PubMed
    1. Stratton LM, Adler AJ, Neil HA, et al. Association of glycaemia with macrovascular and microvascular complications of type 2 diabetes (UKPDS 35): prospective observational study. BMJ. 2000;321:405–412. - PMC - PubMed
    1. Morrish NJ, Wang SL, Stevens LK, et al. Mortality and causes of death in the WHO multinational study of vascular disease in diabetes. Diabetologia. 2001;44(Suppl 2):S14–S21. - PubMed
    1. Haffner SM, Lehto S, Ronnemaa T, et al. Mortality from coronary heart disease in subjects with type 2 diabetes and in nondiabetic subjects with and without prior myocardial infarction. N Engl J Med. 1998;339:229–234. - PubMed

MeSH terms

Substances