

Previous estimates of mitochondrial DNA mutation level variance did not account for sampling error: comparing the mtDNA genetic bottleneck in mice and humans
- PMID: 20362273
- PMCID: PMC2850432
- DOI: 10.1016/j.ajhg.2010.02.023
Previous estimates of mitochondrial DNA mutation level variance did not account for sampling error: comparing the mtDNA genetic bottleneck in mice and humans
Abstract
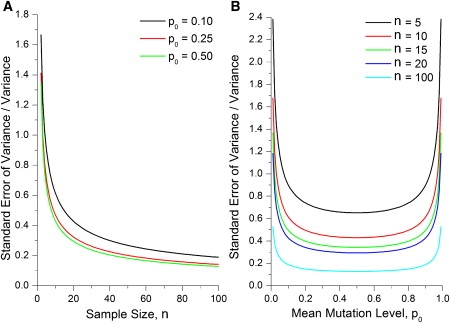
In cases of inherited pathogenic mitochondrial DNA (mtDNA) mutations, a mother and her offspring generally have large and seemingly random differences in the amount of mutated mtDNA that they carry. Comparisons of measured mtDNA mutation level variance values have become an important issue in determining the mechanisms that cause these large random shifts in mutation level. These variance measurements have been made with samples of quite modest size, which should be a source of concern because higher-order statistics, such as variance, are poorly estimated from small sample sizes. We have developed an analysis of the standard error of variance from a sample of size n, and we have defined error bars for variance measurements based on this standard error. We calculate variance error bars for several published sets of measurements of mtDNA mutation level variance and show how the addition of the error bars alters the interpretation of these experimental results. We compare variance measurements from human clinical data and from mouse models and show that the mutation level variance is clearly higher in the human data than it is in the mouse models at both the primary oocyte and offspring stages of inheritance. We discuss how the standard error of variance can be used in the design of experiments measuring mtDNA mutation level variance. Our results show that variance measurements based on fewer than 20 measurements are generally unreliable and ideally more than 50 measurements are required to reliably compare variances with less than a 2-fold difference.
(c) 2010 The American Society of Human Genetics. Published by Elsevier Inc. All rights reserved.
Figures


Similar articles
-
The distribution of mitochondrial DNA heteroplasmy due to random genetic drift.Am J Hum Genet. 2008 Nov;83(5):582-93. doi: 10.1016/j.ajhg.2008.10.007. Epub 2008 Oct 30. Am J Hum Genet. 2008. PMID: 18976726 Free PMC article.
-
Very low-level heteroplasmy mtDNA variations are inherited in humans.J Genet Genomics. 2013 Dec 20;40(12):607-15. doi: 10.1016/j.jgg.2013.10.003. Epub 2013 Dec 8. J Genet Genomics. 2013. PMID: 24377867 Free PMC article.
-
Age-related accumulation of de novo mitochondrial mutations in mammalian oocytes and somatic tissues.PLoS Biol. 2020 Jul 15;18(7):e3000745. doi: 10.1371/journal.pbio.3000745. eCollection 2020 Jul. PLoS Biol. 2020. PMID: 32667908 Free PMC article.
-
Mitochondrial DNA and the mammalian oocyte.Curr Top Dev Biol. 2007;77:87-111. doi: 10.1016/S0070-2153(06)77004-1. Curr Top Dev Biol. 2007. PMID: 17222701 Review.
-
Mitochondria and Their Role in Human Reproduction.DNA Cell Biol. 2020 Aug;39(8):1370-1378. doi: 10.1089/dna.2019.4807. Epub 2019 Oct 11. DNA Cell Biol. 2020. PMID: 31603716 Review.
Cited by
-
Pathogenic mitochondrial DNA 3243A>G mutation: From genetics to phenotype.Front Genet. 2022 Oct 6;13:951185. doi: 10.3389/fgene.2022.951185. eCollection 2022. Front Genet. 2022. PMID: 36276941 Free PMC article. Review.
-
Stochastic modelling, Bayesian inference, and new in vivo measurements elucidate the debated mtDNA bottleneck mechanism.Elife. 2015 Jun 2;4:e07464. doi: 10.7554/eLife.07464. Elife. 2015. PMID: 26035426 Free PMC article.
-
Preventing the transmission of pathogenic mitochondrial DNA mutations: Can we achieve long-term benefits from germ-line gene transfer?Hum Reprod. 2013 Mar;28(3):554-9. doi: 10.1093/humrep/des439. Epub 2013 Jan 7. Hum Reprod. 2013. PMID: 23297368 Free PMC article.
-
Rapid mitochondrial DNA segregation in primate preimplantation embryos precedes somatic and germline bottleneck.Cell Rep. 2012 May 31;1(5):506-15. doi: 10.1016/j.celrep.2012.03.011. Cell Rep. 2012. PMID: 22701816 Free PMC article.
-
Mitochondrial DNA Heteroplasmy and Purifying Selection in the Mammalian Female Germ Line.Dev Growth Differ. 2018 Jan;60(1):21-32. doi: 10.1111/dgd.12420. Epub 2018 Jan 24. Dev Growth Differ. 2018. PMID: 29363102 Free PMC article. Review.
References
-
- Chinnery P.F., Zwijnenburg P.J.G., Walker M., Howell N., Taylor R.W., Lightowlers R.N., Bindoff L., Turnbull D.M. Nonrandom tissue distribution of mutant mtDNA. Am. J. Med. Genet. 1999;85:498–501. - PubMed
-
- Durham S.E., Bonilla E., Samuels D.C., DiMauro S., Chinnery P.F. Mitochondrial DNA copy number threshold in mtDNA depletion myopathy. Neurology. 2005;65:453–455. - PubMed
-
- Shoubridge E.A. Mitochondrial DNA diseases: Histological and cellular studies. J. Bioenerg. Biomembr. 1994;26:301–310. - PubMed
-
- Chinnery P.F., Thorburn D.R., Samuels D.C., White S.L., Dahl H.M., Turnbull D.M., Lightowlers R.N., Howell N. The inheritance of mitochondrial DNA heteroplasmy: Random drift, selection or both? Trends Genet. 2000;16:500–505. - PubMed
Publication types
MeSH terms
Substances
Grants and funding
LinkOut - more resources
Full Text Sources
