

FGFR3 signaling induces a reversible senescence phenotype in chondrocytes similar to oncogene-induced premature senescence
- PMID: 20362703
- PMCID: PMC3087869
- DOI: 10.1016/j.bone.2010.03.021
FGFR3 signaling induces a reversible senescence phenotype in chondrocytes similar to oncogene-induced premature senescence
Abstract
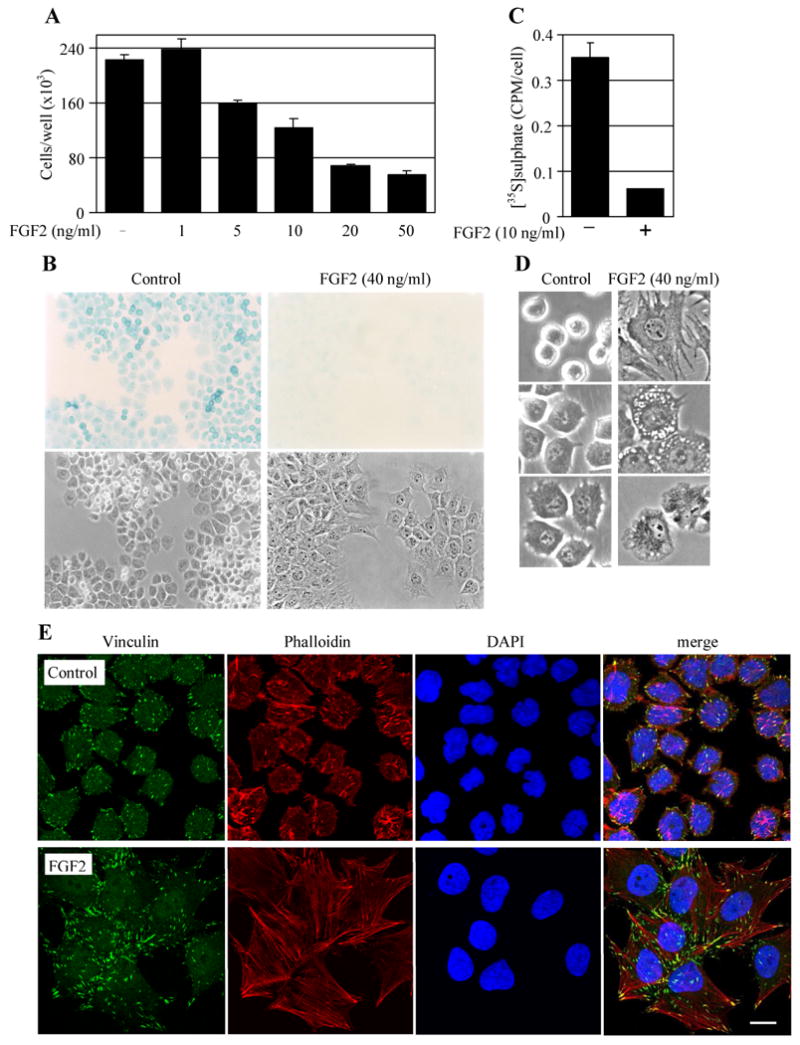
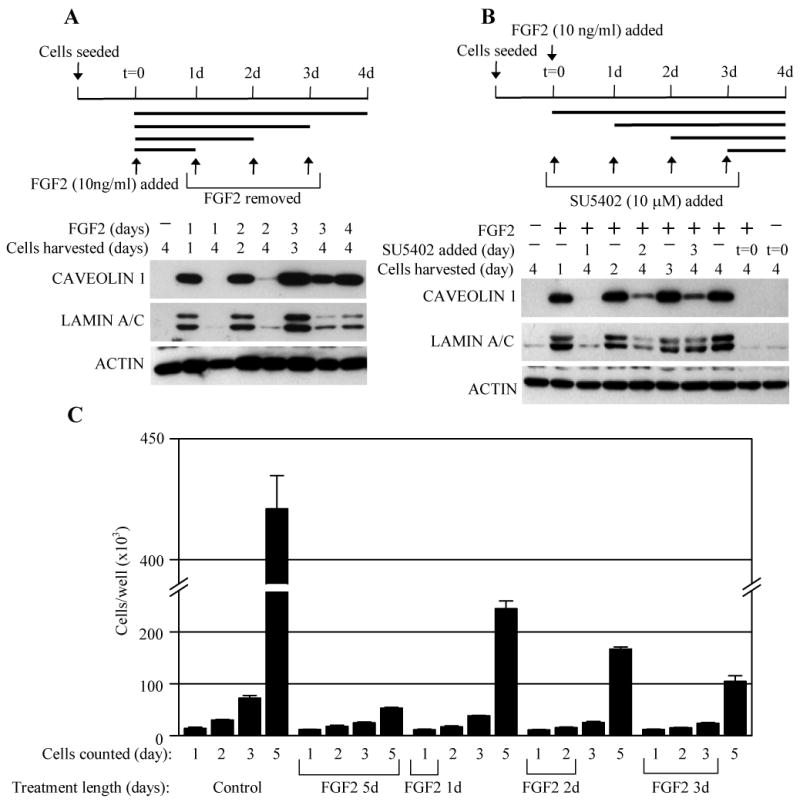
Oncogenic activation of the RAS-ERK MAP kinase signaling pathway can lead to uncontrolled proliferation but can also result in apoptosis or premature cellular senescence, both regarded as natural protective barriers to cell immortalization and transformation. In FGFR3-related skeletal dyplasias, oncogenic mutations in the FGFR3 receptor tyrosine kinase cause profound inhibition of cartilage growth resulting in severe dwarfism, although many of the precise mechanisms of FGFR3 action remain unclear. Mutated FGFR3 induces constitutive activation of the ERK pathway in chondrocytes and, remarkably, can also cause both increased proliferation and apoptosis in growing cartilage, depending on the gestational age. Here, we demonstrate that FGFR3 signaling is also capable of inducing premature senescence in chondrocytes, manifested as reversible, ERK-dependent growth arrest accompanied by alteration of cellular shape, loss of the extracellular matrix, upregulation of senescence markers (alpha-GLUCOSIDASE, FIBRONECTIN, CAVEOLIN 1, LAMIN A, SM22alpha and TIMP 1), and induction of senescence-associated beta-GALACTOSIDASE activity. Our data support a model whereby FGFR3 signaling inhibits cartilage growth via exploiting cellular responses originally designed to eliminate cells harboring activated oncogenes.
2010 Elsevier Inc. All rights reserved.
Figures


Similar articles
-
Meclozine facilitates proliferation and differentiation of chondrocytes by attenuating abnormally activated FGFR3 signaling in achondroplasia.PLoS One. 2013 Dec 4;8(12):e81569. doi: 10.1371/journal.pone.0081569. eCollection 2013. PLoS One. 2013. PMID: 24324705 Free PMC article.
-
Fibroblast growth factor receptor 1 is principally responsible for fibroblast growth factor 2-induced catabolic activities in human articular chondrocytes.Arthritis Res Ther. 2011 Aug 11;13(4):R130. doi: 10.1186/ar3441. Arthritis Res Ther. 2011. Retraction in: Arthritis Res Ther. 2024 Aug 7;26(1):149. doi: 10.1186/s13075-024-03381-y. PMID: 21835001 Free PMC article. Retracted.
-
ARQ 087 inhibits FGFR signaling and rescues aberrant cell proliferation and differentiation in experimental models of craniosynostoses and chondrodysplasias caused by activating mutations in FGFR1, FGFR2 and FGFR3.Bone. 2017 Dec;105:57-66. doi: 10.1016/j.bone.2017.08.016. Epub 2017 Aug 18. Bone. 2017. PMID: 28826843
-
The paradox of FGFR3 signaling in skeletal dysplasia: why chondrocytes growth arrest while other cells over proliferate.Mutat Res Rev Mutat Res. 2014 Jan-Mar;759:40-8. doi: 10.1016/j.mrrev.2013.11.001. Epub 2013 Dec 1. Mutat Res Rev Mutat Res. 2014. PMID: 24295726 Review.
-
Sixteen years and counting: the current understanding of fibroblast growth factor receptor 3 (FGFR3) signaling in skeletal dysplasias.Hum Mutat. 2012 Jan;33(1):29-41. doi: 10.1002/humu.21636. Epub 2011 Nov 16. Hum Mutat. 2012. PMID: 22045636 Free PMC article. Review.
Cited by
-
FGF-2 induces a failure of cell cycle progression in cells harboring amplified K-Ras, revealing new insights into oncogene-induced senescence.Mol Omics. 2021 Oct 11;17(5):725-739. doi: 10.1039/d1mo00019e. Mol Omics. 2021. PMID: 34636387 Free PMC article.
-
Quantitative and qualitative differences in the activation of a fibroblast growth factor receptor by different FGF ligands.Cytokine Growth Factor Rev. 2024 Aug;78:77-84. doi: 10.1016/j.cytogfr.2024.07.002. Epub 2024 Jul 9. Cytokine Growth Factor Rev. 2024. PMID: 39043538 Free PMC article. Review.
-
The age-related changes in cartilage and osteoarthritis.Biomed Res Int. 2013;2013:916530. doi: 10.1155/2013/916530. Epub 2013 Jul 22. Biomed Res Int. 2013. PMID: 23971049 Free PMC article. Review.
-
Nitric oxide synthase and breast cancer: role of TIMP-1 in NO-mediated Akt activation.PLoS One. 2012;7(9):e44081. doi: 10.1371/journal.pone.0044081. Epub 2012 Sep 5. PLoS One. 2012. PMID: 22957045 Free PMC article.
-
Receptor tyrosine kinases activate canonical WNT/β-catenin signaling via MAP kinase/LRP6 pathway and direct β-catenin phosphorylation.PLoS One. 2012;7(4):e35826. doi: 10.1371/journal.pone.0035826. Epub 2012 Apr 27. PLoS One. 2012. PMID: 22558232 Free PMC article.
References
-
- Passos-Bueno MR, Wilcox WR, Jabs EW, Sertie AL, Alonso LG, Kitoh H. Clinical spectrum of fibroblast growth factor receptor mutations. Hum Mutat. 1999;14:115–25. - PubMed
-
- Ornoy A, Adomian GE, Eteson DJ, Burgeson RE, Rimoin DL. The role of mesenchyme-like tissue in the pathogenesis of thanatophoric dysplasia. Am J Med Genet. 1985;21:613–30. - PubMed
-
- Hafner C, Stoehr R, van Oers JM, Zwarthoff EC, Hofstaedter F, Landthaler M, Hartmann A, Vogt T. FGFR3 and PIK3CA mutations are involved in the molecular pathogenesis of solar lentigo. Br J Dermatol. 2009;160:546–51. - PubMed
-
- Hernández S, de Muga S, Agell L, Juanpere N, Esgueva R, Lorente JA, Mojal S, Serrano S, Lloreta J. FGFR3 mutations in prostate cancer: association with low-grade tumors. Mod Pathol. 2009;22:848–56. - PubMed
Publication types
MeSH terms
Substances
Grants and funding
LinkOut - more resources
Full Text Sources
Other Literature Sources
Molecular Biology Databases
Research Materials
Miscellaneous
