. 2010 Jun;298(6):H1699-709.
doi: 10.1152/ajpheart.01131.2009. Epub 2010 Apr 2.

A biophysical model for cardiac microimpedance measurements

Affiliations

A biophysical model for cardiac microimpedance measurements

Andrew E Pollard et al. Am J Physiol Heart Circ Physiol. 2010 Jun.

Abstract

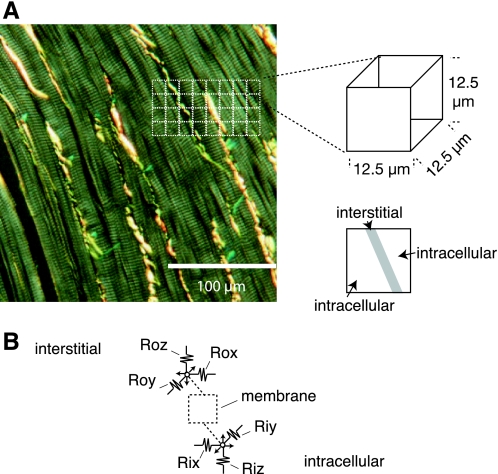
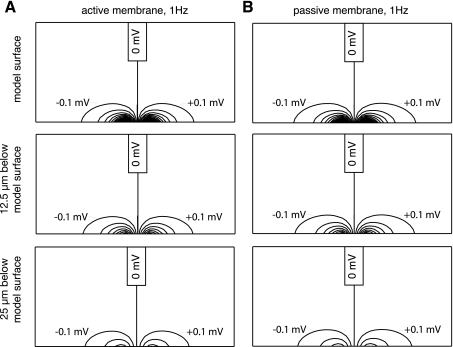
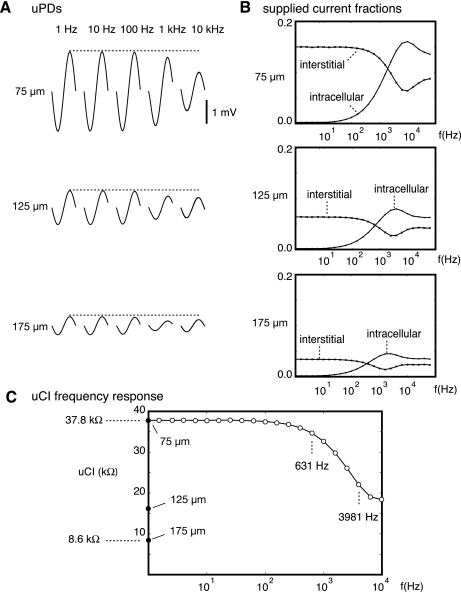
Alterations to cell-to-cell electrical conductance and to the structural arrangement of the collagen network in cardiac tissue are recognized contributors to arrhythmia development, yet no present method allows direct in vivo measurements of these conductances at their true microscopic scale. The present report documents such a plan, which involves interstitial multisite stimulation at a subcellular to cellular size scale, and verifies the performance of the method through biophysical modeling. Although elements of the plan have been analyzed previously, their performance as a whole is considered here in a comprehensive way. Our analyses take advantage of a three-dimensional structural framework in which interstitial, intracellular, and membrane components are coupled to one another on the fine size scale, and electrodes are separated from one another as in arrays we fabricate routinely. With this arrangement, determination of passive tissue resistances can be made from measurements taken on top of the currents flowing in active tissue. In particular, our results show that measurements taken at multiple frequencies and electrode separations provide powerful predictions of the underlying tissue resistances in all geometric dimensions. Because of the small electrode size, separation of interstitial from intracellular compartment contributions is readily achieved.


Figures

Fig. 1.
Fig. 1.
A: micrograph of rabbit ventricular subepicardium stained with picrosirius red and imaged using polarized light. Squares mark 12.5 × 12.5 μm2 regions in the micrograph. B: circuit representation for a building block. (Rox,Roy,Roz) make interstitial connections to neighboring blocks, (Rix,Riy,Riz) make intracellular connections to neighboring blocks, and the interstitial and intracellular compartments are coupled by membrane.
Fig. 2.
Fig. 2.
A: arrangement of stimulation (■) and recording (☐) electrodes assumed for all simulations. B: schematic diagram of the 3-dimensional myocyte network used for active and passive membrane simulations, including the surface location for the electrode array.
Fig. 3.
Fig. 3.
A: isopotential contour maps of ϕo assembled from values obtained in an active membrane simulation with 1 Hz stimulation and 75 μm separation between stimulating electrodes. Maps were built using ϕo distributions from the model surface where the electrodes were positioned (top), from the layer of building blocks located 12.5 μm below the model surface (middle), and from the layer of blocks located 25 μm below the model surface (bottom). B: isopotential contour maps of ϕo assembled from values obtained a passive membrane simulation that represented the conditions shown in A.
Fig. 4.
Fig. 4.
A: microscopic potential differences (uPDs) recorded during active simulations in which Istim supplied between electrodes separated by 75 (top), 125 (middle), and 175 μm (bottom) and frequencies adjusted from 1 Hz (left) to 10 kHz (right). Each dashed line marks peak uPD at 1 Hz. All uPDs were aligned at 0 mV. B: fraction of supplied current measured between building blocks used for the uPD recordings expressed as a function of frequency for the stimulating electrode separations considered in A. C: UcIts using different stimulating electrode combinations (●) and frequencies (○).
Fig. 5.
Fig. 5.
A: percent error between prescribed and measured Rox (top), Roy (middle), and Roz (bottom) from 200 different trials in which overestimation and underestimation of uCI amplitude was considered in interstitial associated ARC table analyses. B: Rix (top), Riy (middle), and Riz (bottom) percent errors during different trials with in intracellular ARC table analyses.

References

    1. Barr RC, Nolte LW, Pollard AE. Bayesian analysis of fiber impedance measurements. Conf Proc IEEE Eng Med Biol Soc 1: 423–429, 2007 - PubMed
    1. Cabo C, Boyden PA. Extracellular space attenuates the effect of gap junctional remodeling on wave propagation: a computational study. Biophys J 96: 3092–3101, 2009 - PMC - PubMed
    1. Cabo C, Yao JA, Boyden PA, Chen W, Hussain W, Duffy HS, Ciaccio EJ, Peters NS, Wit AL. Heterogeneous gap junction remodeling in reentrant circuits in the epicardial border zone of the healing canine infarct. Cardiovasc Res 72: 241–249, 2006 - PubMed
    1. Cascio WE, Yan GX, Kléber AG. Passive electrical properties, mechanical activity and extracellular potassium in arterially perfused and ischemic rabbit ventricular muscle. Effects of calcium entry blockade or hypocalcemia. Circ Res 66: 1461–1473, 1990 - PubMed
    1. Chapman RA, Fry CH. An analysis of the cable properties of frog ventricular myocardium. J Physiol 283: 263–282, 1978 - PMC - PubMed

Publication types

LinkOut - more resources