

Loss of Nkx3.1 expression in bacterial prostatitis: a potential link between inflammation and neoplasia
- PMID: 20363913
- PMCID: PMC2861091
- DOI: 10.2353/ajpath.2010.080747
Loss of Nkx3.1 expression in bacterial prostatitis: a potential link between inflammation and neoplasia
Abstract
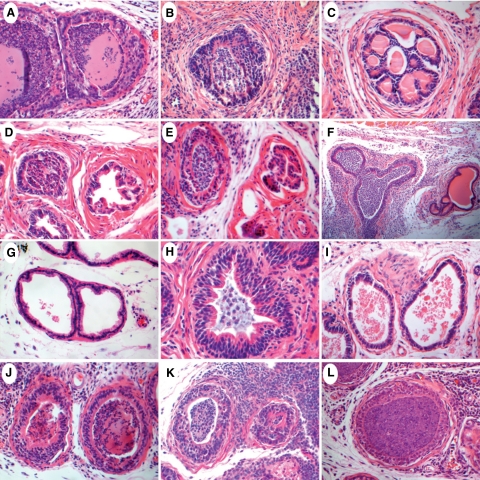
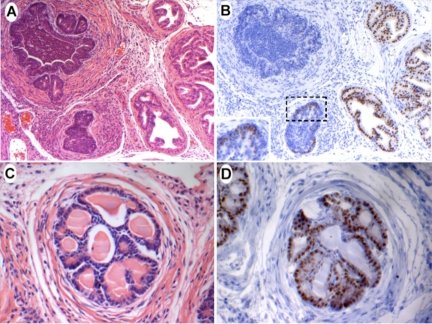
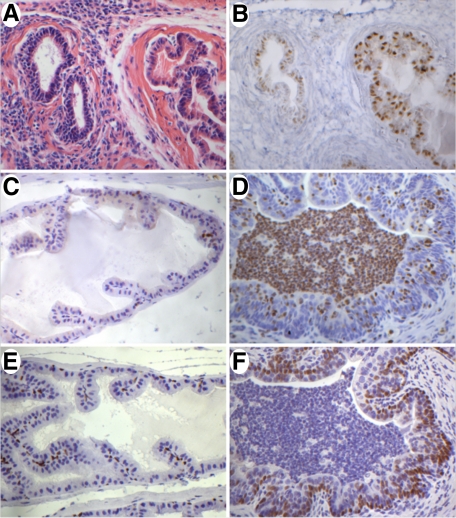
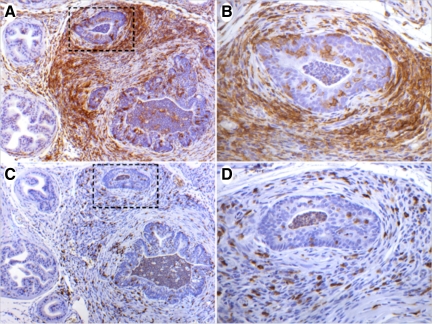
NKX3.1 is a homeodomain protein that functions as a dosage sensitive prostate-specific transcription factor. Diminished NKX3.1 expression is associated with prostate epithelial cell proliferation in vitro and with increasing Gleason grade in patient samples. Mouse Nkx3.1 also functions as a negative regulator of prostate cell growth in prostate cancer models. Identifying biological and environmental factors that modulate NKX3.1 accumulation is therefore central to efforts aimed at elucidating prostate growth control mechanisms. To determine the effect of inflammation on Nxk3.1 accumulation, bacterial prostatitis was induced by intraurethral inoculation of a uropathogenic E. coli strain in mice. Nkx3.1 expression was profoundly reduced in infected prostate lobes and correlated with increased expression of a proliferation marker. Androgen receptor levels were also reduced in concert with Nkx3.1, and a marked increase in the basal cell marker p63 was observed. Analyses of the inflammatory infiltrate revealed a classic acute inflammatory response that attained characteristics of a chronic state within fourteen days postinoculation. Comparison of the four prostate lobes revealed clear differences in the extent of inflammation. These data demonstrate that acute inflammation in response to a bacterial agent in the prostate is associated with a significant diminution in the level of a key regulator of prostate cell proliferation. These observations provide a plausible mechanism whereby prostate inflammation may establish a local environment conducive to epithelial cell growth.
Figures
Similar articles
-
Cooperation of loss of NKX3.1 and inflammation in prostate cancer initiation.Dis Model Mech. 2018 Nov 16;11(11):dmm035139. doi: 10.1242/dmm.035139. Dis Model Mech. 2018. PMID: 30266798 Free PMC article.
-
Decreased NKX3.1 protein expression in focal prostatic atrophy, prostatic intraepithelial neoplasia, and adenocarcinoma: association with gleason score and chromosome 8p deletion.Cancer Res. 2006 Nov 15;66(22):10683-90. doi: 10.1158/0008-5472.CAN-06-0963. Cancer Res. 2006. PMID: 17108105
-
Loss of Nkx3.1 expression in the transgenic adenocarcinoma of mouse prostate model.Prostate. 2007 Dec 1;67(16):1740-50. doi: 10.1002/pros.20579. Prostate. 2007. PMID: 17929276
-
Mechanisms of prostate tumorigenesis: roles for transcription factors Nkx3.1 and Egr1.Ann N Y Acad Sci. 2005 Nov;1059:33-40. doi: 10.1196/annals.1339.018. Ann N Y Acad Sci. 2005. PMID: 16382041 Review.
-
Roles of the Nkx3.1 homeobox gene in prostate organogenesis and carcinogenesis.Dev Dyn. 2003 Dec;228(4):767-78. doi: 10.1002/dvdy.10397. Dev Dyn. 2003. PMID: 14648854 Review.
Cited by
-
Trichomonas vaginalis adherence phenotypes and extracellular vesicles impact parasite survival in a novel in vivo model of pathogenesis.PLoS Negl Trop Dis. 2023 Oct 23;17(10):e0011693. doi: 10.1371/journal.pntd.0011693. eCollection 2023 Oct. PLoS Negl Trop Dis. 2023. PMID: 37871037 Free PMC article.
-
TNFα-mediated loss of β-catenin/E-cadherin association and subsequent increase in cell migration is partially restored by NKX3.1 expression in prostate cells.PLoS One. 2014 Oct 31;9(10):e109868. doi: 10.1371/journal.pone.0109868. eCollection 2014. PLoS One. 2014. PMID: 25360740 Free PMC article.
-
Immune Infiltration and Prostate Cancer.Front Oncol. 2015 Jul 8;5:128. doi: 10.3389/fonc.2015.00128. eCollection 2015. Front Oncol. 2015. PMID: 26217583 Free PMC article. Review.
-
LGR5 promotes invasion and migration by regulating YAP activity in hypopharyngeal squamous cell carcinoma cells under inflammatory condition.PLoS One. 2022 Oct 26;17(10):e0275679. doi: 10.1371/journal.pone.0275679. eCollection 2022. PLoS One. 2022. PMID: 36288272 Free PMC article.
-
NKX3.1 Expression Contributes to Epithelial-Mesenchymal Transition of Prostate Cancer Cells.ACS Omega. 2023 Sep 1;8(36):32580-32592. doi: 10.1021/acsomega.3c03127. eCollection 2023 Sep 12. ACS Omega. 2023. PMID: 37720744 Free PMC article.
References
-
- Jemal A, Siegel R, Ward E, Murray T, Xu J, Thun MJ. Cancer statistics, 2007. CA Cancer J Clin. 2007;57:43–66. - PubMed
-
- Sciavolino PJ, Abate-Shen C. Molecular biology of prostate development and prostate cancer. Ann Med. 1998;30:357–368. - PubMed
-
- Lee F, Torp-Pedersen ST, Siders DB, Littrup PJ, McLeary RD. Transrectal ultrasound in the diagnosis and staging of prostatic carcinoma. Radiology. 1989;170:609–615. - PubMed
-
- McNeal JE. Cancer volume and site of origin of adenocarcinoma in the prostate: relationship to local and distant spread. Hum Pathol. 1992;23:258–266. - PubMed
Publication types
MeSH terms
Substances
LinkOut - more resources
Full Text Sources
Medical
Molecular Biology Databases
