. 2010 May;120(5):1708-21.
doi: 10.1172/JCI40794. Epub 2010 Apr 1.

Loss of enteroendocrine cells in mice alters lipid absorption and glucose homeostasis and impairs postnatal survival

Affiliations

Loss of enteroendocrine cells in mice alters lipid absorption and glucose homeostasis and impairs postnatal survival

Georg Mellitzer et al. J Clin Invest. 2010 May.

Abstract

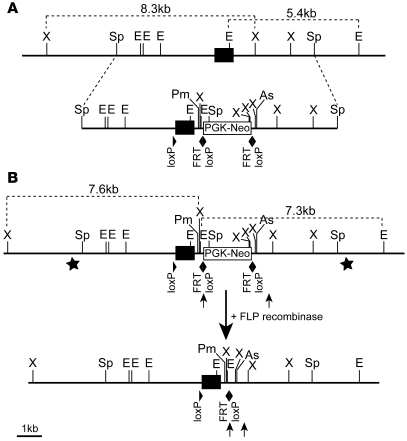
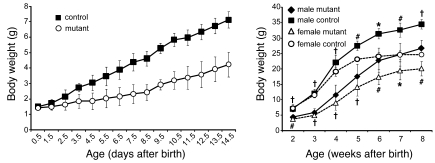
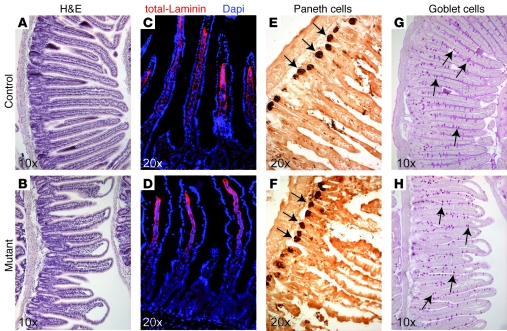
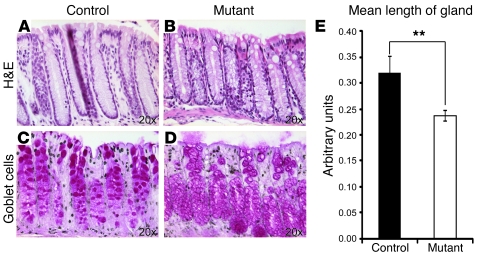
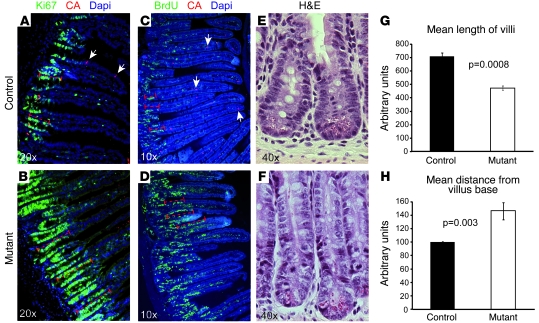
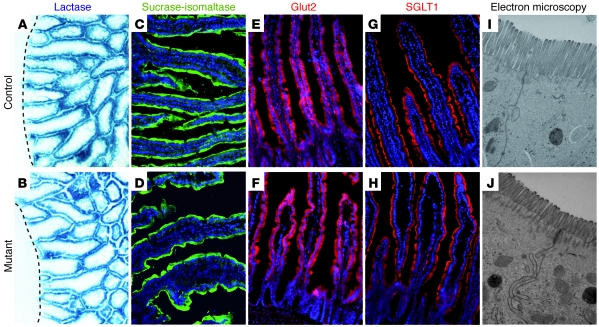
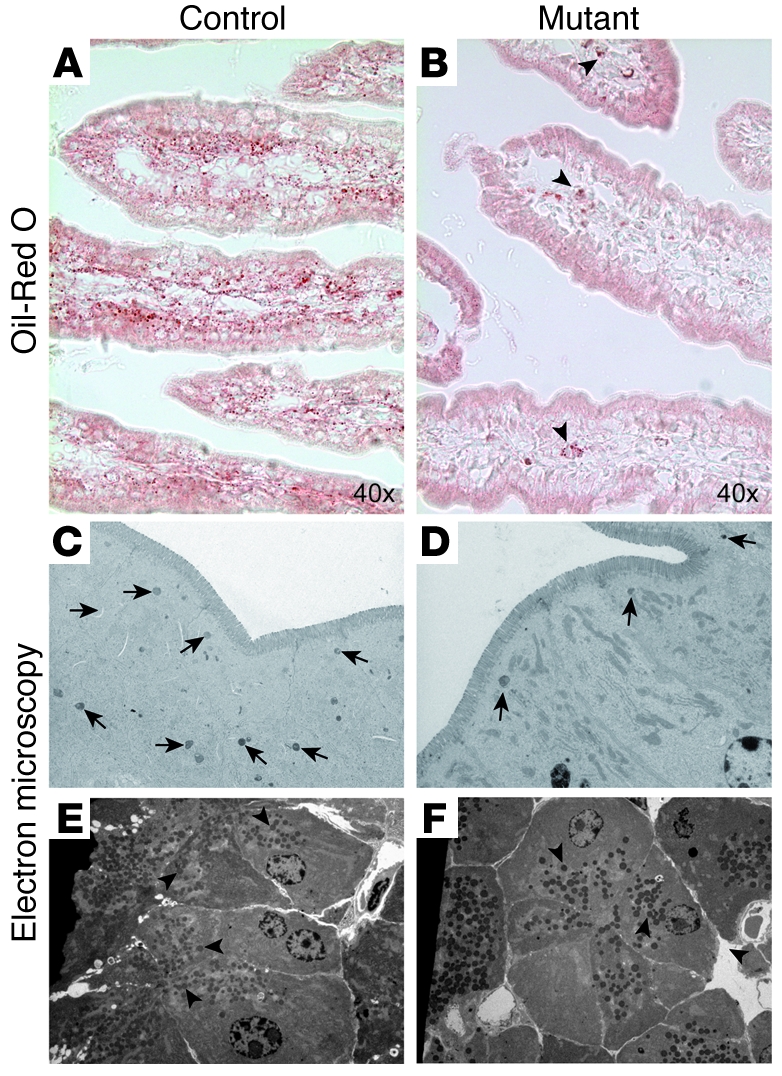
At least 10 enteroendocrine cell types have been identified, and the peptide hormones they secrete have diverse functions that include regulation of glucose homeostasis, food intake, and gastric emptying. Mice lacking individual enteroendocrine hormones, their receptors, or combinations of these have shed light on the role of these hormones in the regulation of energy homeostasis. However, because enteroendocrine hormones have partially overlapping functions, these loss-of-function studies produced only minor phenotypes, and none of the enteroendocrine hormones was shown to be essential for life. To examine the effect of loss of all enteroendocrine cells and hormones on energy homeostasis, we generated mice with intestinal-specific ablation of the proendocrine transcription factor neurogenin 3 (referred to herein as Ngn3Deltaint mice). Ngn3Deltaint mice were deficient for all enteroendocrine cells and hormones, and died with a high frequency during the first week of life. Mutant mice were growth retarded and had yellowish stool suggestive of steatorrhea. Subsequent analyses revealed that Ngn3Deltaint mice had impaired lipid absorption, reduced weight gain, and improved glucose homeostasis. Furthermore, intestinal epithelium of the mutant mice showed an enlarged proliferative crypt compartment and accelerated cell turnover but no changes to goblet and Paneth cell numbers. Enterocytes had shorter microvilli, but the expression of the main brush border enzymes was unaffected. Our data help unravel the role of enteroendocrine cells and hormones in lipid absorption and maintenance of the intestinal epithelium.


Figures

Figure 1
Figure 1. Generation of animals with a conditional Ngn3 allele.
(A) Schema depicting the Ngn3 locus and the targeting construct. (B) Targeted Ngn3 allele before and after the excision of the FRT flanked “PGK-Neo” selection cassette by the FLP recombinase. Stars in B indicate the position of the 5′- and 3′-external probes used for Southern blot analysis (see Supplemental Figure 1). (A and B) The black boxes indicate the Ngn3 coding sequence. The PGK-Neomycin selection cassette, the loxP, and FRT sites are indicated as well. X, XbaI; Sp, SpeI; E, EcoRI; Pm, PmeI; As, AscI.
Figure 2
Figure 2. Fifty percent of mutant mice with an intestinal deletion of Ngn3 (Ngn3Δint) die within the first 8 days of life.
(A) Photography taken at P3.5 of a wild-type, mutant (MTa), and mutant mouse found dead (MTb) from the same litter. From P3.5 on, mutant animals start to be visibly smaller than control littermates. (BD) Photography of the dissected intestinal tractus from the wild-type and mutant mice shown in A, taken with the same magnification (original magnification, ×0.8). The presence of milk in the stomach of mutant mice indicates their ability to suck milk.
Figure 3
Figure 3. Mutant mice gain less body weight than control littermates.
During the first 2 weeks of life, the weight of wild-type (control) and mutant mice was taken every day (left graph) and thereafter once a week for a period of 6 more weeks (right graph). Mutant mice do gain less weight than control mice and keep, at adult stages, about 30% lower body weight than control littermates. Control, n = 66; mutant, n = 35, for all time points measured; P < 0.008 (left graph). Male control, n = 8; male mutant, n = 5; female control, n = 5; female mutant, n = 4; *P < 0.05, #P < 0.01, P < 0.001 (right graph).
Figure 4
Figure 4. Conditional inactivation of Ngn3 in only the intestine results in a complete loss of all enteroendocrine cells all along the proximal-distal axis of the intestine.
Sections of adult duodenum, jejunum, ileum, and colon were examined for the presence of endocrine cells in control and mutant animals by immunofluorescence. Images presented are from the jejunum of control (A, C, E, G, and I) and mutant (B, D, F, H, and J) animals and are representative for the general loss of all enteroendocrine cells in mutant animals. Villin-Cre–mediated inactivation of Ngn3 results in a complete loss of all Ngn3+ enteroendocrine progenitors (B), which in wild-type animals are located in the intestinal crypt compartment (A, arrows). Likewise, mutant animals are also devoid of chromogranin A+ (D), Cck/gastrin+ (F), Glp1+ (H), and Gip+ (J) cells, normally located in the villi of wild-type mice (arrows in C, E, G, and I), respectively. The age of the animals analyzed is 10–12 weeks. Original magnification, ×10.
Figure 5
Figure 5. Intestinal ablation of Ngn3 leads to an altered morphology of the small intestine but normal Paneth and goblet cell differentiation.
Sections of adult wild-type and mutant duodenum, jejunum, and ileum were examined for their overall appearance (AD) and the presence of Paneth (E and F) and goblet cells (G and H). Images presented are from the jejunum of control (A, C, E, and G) and mutant (B, D, F, and H) animals and are also representative for the phenotype observed in the duodenum and ileum of mutant animals. (A and B) H&E staining clearly shows the frequent blunt or club-shaped appearance of the villi and the disorganization of the crypt compartment of mutant animals compared with control small intestine. (C and D) Immunofluorescence analyses with an antibody recognizing all laminins, showing the frequent detachment of the intestinal epithelium from the lamina propria in mutant small intestine. (E and F) Immunohistochemistry with an anti-lysozyme antibody demonstrates normal appearance and location of Paneth cells (arrows in E and F) in mutant small intestine. (G and H) Likewise, periodic acid–Schiff staining shows that intestinal ablation of Ngn3 does not alter the location or number of goblet cells (arrows in G and H) in mutant animals. For Paneth and goblet cell counts, see Supplemental Figure 5. The age of the animals analyzed is 10–12 weeks.
Figure 6
Figure 6. The large intestine of mutant mice shows shorter glands.
Sections of adult wild-type (A and C) and mutant (B and D) large intestine were examined for their overall appearance (A and B) and the presence of goblet cells (C and D). (A and B) H&E staining clearly shows the reduction in the length of the glands in the large intestine of mutant mice (B, measurement in E) compared with control tissue. (C and D) Periodic acid–Schiff staining of goblet cells. (E) The colonic glands in mutant animals are on average 26% shorter than the colonic glands of control animals (n = 4; 50–60 glands were analyzed per genotype). **P < 0.01. The age of the animals analyzed is 10–12 weeks.
Figure 7
Figure 7. Altered cell homeostasis in Ngn3-deficient small intestine.
Sections of adult control (A, C, and E) and mutant (B, D, and F) intestine were examined for the status of the proliferative crypt compartment (A, B, E, and F), villus length (measurements in G), and cell turn over (C, D, and measurement in H). (A and B) Immunofluorescence staining for the proliferative cell marker Ki67 clearly demonstrates an up to 2-fold enlargement of the proliferative crypt compartment (dashed bars in A and B) in Ngn3-deficient intestine. Arrows point to chromogranin A+ cells. (G) Measurement of the villi length indicates an approximately 40% reduction in their length in mutant intestine. (C and D) Twenty-four hours before dissection, adult control and mutant mice were injected with BrdU, and BrdU-labeled cells were then visualized by immunofluorescence staining. Then the distance from the villus base to last labeled BrdU+ cell was measured (dashed bars in C and D), demonstrating a 1.6-fold accelerated cell turnover in Ngn3-deficient intestine. Arrows point to chromogranin A+ cells. (E and F) H&E staining showing the enlargement of the crypt compartment seen in Ngn3 mutant intestine. n = 3. The age of the animals analyzed is 10–12 weeks.
Figure 8
Figure 8. Strong reduction of the intestinal absorptive surface area but normal expression of brush border enzymes and glucose transporters in Ngn3-deficient mice.
Sections of control (A, C, E, G, and I) and mutant (B, D, F, H, and J) intestine were examined for the status of the absorptive cell population. Analyses of the lactase activity (A and B) and immunofluorescence staining for sucrase-isomaltase (C and D), the active glucose transporter Glut2 (E and F), and the passive glucose transporter SGLT1 (G and H) did not show any difference between control and mutant tissue, respectively. (I and J) Ultrastructural analysis of the brush border of the absorptive cells demonstrates a strong reduction of the microvilli length in mutant mice. The dashed lines in A and B indicate the bottom of the crypt compartment. The age of the mice analyzed in A and B is P1.5 and in CJ is 10–12 weeks. Original magnification, ×20 (AH); ×40,000 (I and J).
Figure 9
Figure 9. Impaired lipid absorption in Ngn3Δint mutant mice.
Oil red O, which stains neutral fats, was used to visualize lipid droplets in control (A) and mutant (B) tissue. Mutant small intestine clearly shows a strong reduction in the amount of lipid droplets (B) compared with control tissue (A). Arrowheads in B point to some lipid droplets found in mutant tissue. Ultrastructural analysis of the absorptive cells furthermore demonstrates a clear reduction in the number of neutral lipid-containing chylomicrons (arrows in C and D) in Ngn3–deficient intestine (D). (E and F) Ultrastructural analysis of exocrine pancreas at adult stage shows no difference in the number or quality of zymogen granules (arrowheads) in acinar cells in control (E) and mutant animals (F). The age of the mice analyzed is 10–12 weeks. Original magnification, ×10,000 (C and D); ×4,000 (E and F).
Figure 10
Figure 10. Reduced levels of cholesterol and triglyceride in the blood of Ngn3Δint mice.
(A) Twenty-seven–week-old Ngn3Δint mice have reduced cholesterol and triglyceride levels in the blood (n = 6; *P < 0.05, **P < 0.01). (B) Similar levels of lipase, a digestive enzyme mainly produced and secreted by the acinar cells in the pancreas, are found in the blood of 27-week-old control and mutant mice (n = 4–5).
Figure 11
Figure 11. Altered glucose homeostasis in Ngn3Δint mice.
Control (filled squares) and mutant mice (filled circles) were subjected to either an oral (A, OGTT) or intraperitoneal (B, IPGTT) glucose challenge or an ITT. Blood glucose levels were then measured at the indicated time points. (A) In the OGTT, mutant mice show a slightly improved glucose clearance from the blood. (B) In the IPGTT, at all time points measured, blood glucose levels of mutant mice do not rise to the same levels as in control mice. (C) The ITT clearly shows an improved insulin sensitivity of mutant compared with control mice. n = 6–7, for control and mutant mice. “0” indicates the blood glucose level before the glucose challenge. *P < 0.05, **P < 0.01, ***P < 0.001. The age of the mice analyzed is 7–10 weeks.
Figure 12
Figure 12. Reduced levels of several intestinal and pancreatic hormones in the blood of intestinal Ngn3-deficient mice.
After an oral glucose challenge, blood was taken from Ngn3Δint and control mice and analyzed. Ngn3Δint mice show a complete lack of the intestinal hormones GIP and PYY and reduced levels of ghrelin. Likewise, blood serum concentration levels of the pancreatic hormones insulin, amylin, and PP are also strongly reduced. The age of the mice analyzed is 9–10 weeks. n = 6, for mutant and control mice.
Figure 13
Figure 13. Improved BMI and insulin sensitivity in 27-week-old Ngn3Δint mice.
(A and B) The body composition of age- and sex-matched mutant and control mice was analyzed. Ngn3Δint mice have approximately 30% less body fat (A), are leaner (B), and show an improved BMI (C) compared with control mice. (D) Control (filled squares) and mutant (filled circles) mice were fasted and subjected to an ITT. Mutant mice show improved insulin sensitivity, seen also by the reduction in the average under the curve between 0–45 minutes after insulin injection (AUC, left inset). In addition, mutant mice show a clear difference in the fasting blood glucose level (right inset). n = 6–7. *P < 0.05, **P < 0.01.
Figure 14
Figure 14. Altered islet architecture in Ngn3Δint mice.
(A) Ngn3Δint mice show a decrease of large and an increase of single islets compared with control mice. (B) The contribution of islets of a particular size to the total islet volume is shifted from large to single and small islets in mutant mice compared with control mice. (C) Immunostaining for insulin (green) and glucagon (red) on a pancreatic section of control and Ngn3Δint mutant mice. In mutant mice, glucagon-positive cells appear in the periphery and ectopically in the center of the islets, whereas in control mice, they are normally exclusively located at the periphery. (D) Quantitative analyses of C. (A, B, and D) Control, black columns; mutant, white columns. Islet sizes were classified as follows: single, <300 μm; small, 300–5,000 μm; medium, 5,000–20,000 μm; and large, >20,000 μm; n = 5, all male; 1,500–2,000 islets counted per genotype. The age of the mice analyzed is 8–9 weeks. *P < 0.05, **P < 0.01, ***P < 0.001.
Figure 15
Figure 15. Accelerated food transit and increased feces production in Ngn3Δint mice.
(A) Age- and sex-matched mutant and control mice were fasted overnight and given then simultaneously access to colored food. The time of the appearance of the first colored stool was then taken and normalized to their body weight. Mutant mice have a 2.3-fold accelerated intestinal food transit. (B) The feces of control and mutant mice were collected after 1 or 4 days, and their weight was taken. Mutant mice show an up to 2-fold increase in feces production compared with control mice. (A and B) n = 4–5. **P < 0.01, ***P < 0.001.

References

    1. Drucker DJ. The role of gut hormones in glucose homeostasis. J Clin Invest. 2007;117(1):24–32. doi: 10.1172/JCI30076. - DOI - PMC - PubMed
    1. Murphy KG, Bloom SR. Gut hormones and the regulation of energy homeostasis. Nature. 2006;444(7121):854–859. doi: 10.1038/nature05484. - DOI - PubMed
    1. Rindi G, Leiter AB, Kopin AS, Bordi C, Solcia E. The “normal” endocrine cell of the gut: changing concepts and new evidences. Ann N Y Acad Sci. 2004;1014:1–12. doi: 10.1196/annals.1294.001. - DOI - PubMed
    1. Stoffers DA. The development of beta-cell mass: recent progress and potential role of GLP-1. Horm Metab Res. 2004;36(11–12):811–821. doi: 10.1055/s-2004-826168. - DOI - PubMed
    1. Stoffers DA, et al. Insulinotropic glucagon-like peptide 1 agonists stimulate expression of homeodomain protein IDX-1 and increase islet size in mouse pancreas. Diabetes. 2000;49(5):741–748. doi: 10.2337/diabetes.49.5.741. - DOI - PubMed

Publication types