

Control of vaccinia virus skin lesions by long-term-maintained IFN-gamma+TNF-alpha+ effector/memory CD4+ lymphocytes in humans
- PMID: 20364089
- PMCID: PMC2860918
- DOI: 10.1172/JCI38506
Control of vaccinia virus skin lesions by long-term-maintained IFN-gamma+TNF-alpha+ effector/memory CD4+ lymphocytes in humans
Abstract
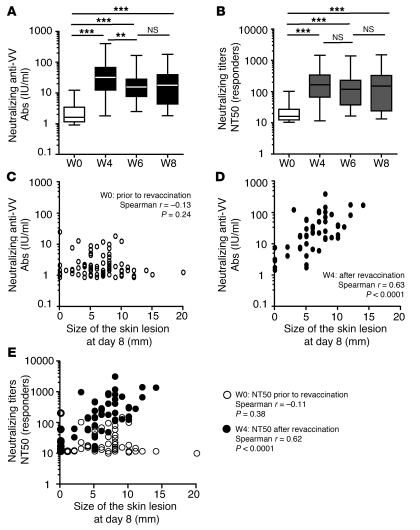
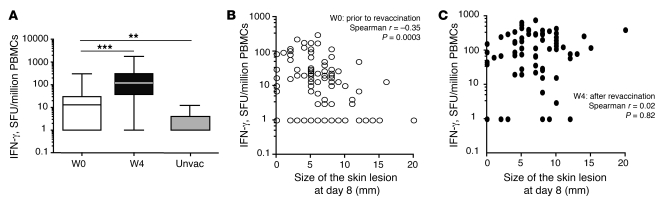
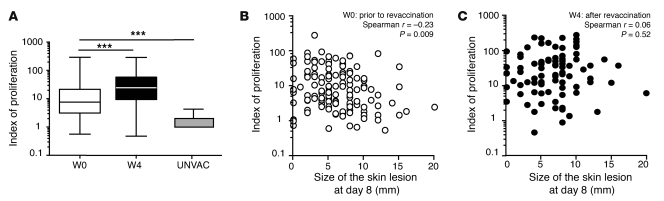
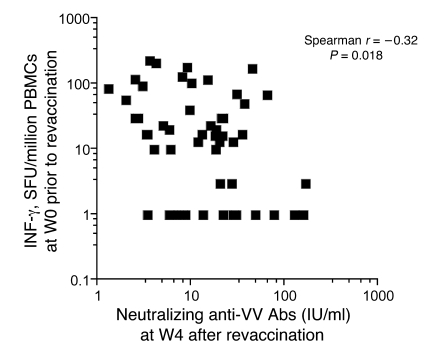
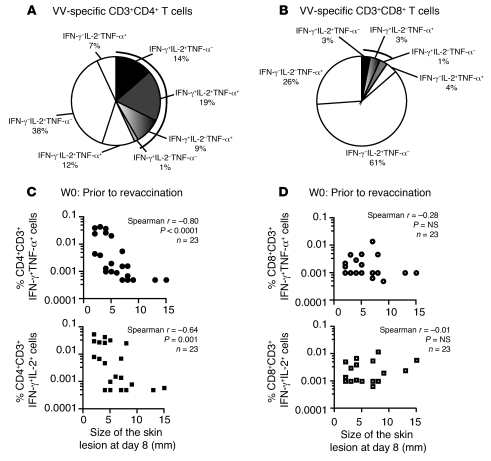
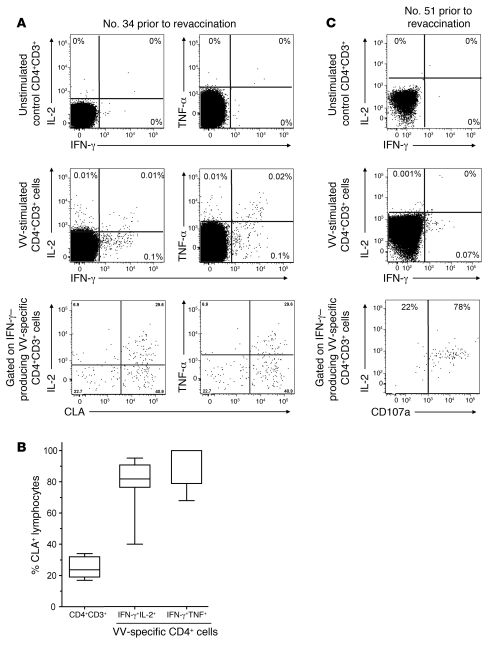
Vaccinia virus (VV) vaccination is used to immunize against smallpox and historically was considered to have been successful if a skin lesion formed at the vaccination site. While antibody responses have been widely proposed as a correlate of efficacy and protection in humans, the role of cellular and humoral immunity in VV-associated skin lesion formation was unknown. We therefore investigated whether long-term residual humoral and cellular immune memory to VV, persisting 30 years after vaccination, could control VV-induced skin lesion in revaccinated individuals. Here, we have shown that residual VV-specific IFN-gamma+TNF-alpha+ or IFN-gamma+IL-2+ CD4+ lymphocytes but not CD8+ effector/memory lymphocytes expressing a skin-homing marker are inversely associated with the size of the skin lesion formed in response to revaccination. Indeed, high numbers of residual effector T cells were associated with lower VV skin lesion size after revaccination. In contrast, long-term residual VV-specific neutralizing antibody (NAbs) titers did not affect skin lesion formation. However, the size of the skin lesion strongly correlated with high levels of NAbs boosted after revaccination. These findings demonstrate a potential role for VV-specific CD4+ responses at the site of VV-associated skin lesion, thereby providing new insight into immune responses at these sites and potentially contributing to the development of new approaches to measure the efficacy of VV vaccination.
Figures
Similar articles
-
Disruption of TNF-α/TNFR1 function in resident skin cells impairs host immune response against cutaneous vaccinia virus infection.J Invest Dermatol. 2012 May;132(5):1425-34. doi: 10.1038/jid.2011.489. Epub 2012 Feb 9. J Invest Dermatol. 2012. PMID: 22318381 Free PMC article.
-
Distinct time effects of vaccination on long-term proliferative and IFN-gamma-producing T cell memory to smallpox in humans.J Exp Med. 2004 Jun 7;199(11):1585-93. doi: 10.1084/jem.20032083. J Exp Med. 2004. PMID: 15184506 Free PMC article.
-
MVA-LACK as a safe and efficient vector for vaccination against leishmaniasis.Microbes Infect. 2006 Mar;8(3):810-22. doi: 10.1016/j.micinf.2005.10.004. Epub 2006 Jan 13. Microbes Infect. 2006. PMID: 16504562
-
Skin inflammation in RelB(-/-) mice leads to defective immunity and impaired clearance of vaccinia virus.J Allergy Clin Immunol. 2007 Mar;119(3):671-9. doi: 10.1016/j.jaci.2006.12.645. J Allergy Clin Immunol. 2007. PMID: 17336617
-
The CD8 T cell response to vaccinia virus exhibits site-dependent heterogeneity of functional responses.Int Immunol. 2007 Jun;19(6):733-43. doi: 10.1093/intimm/dxm039. Epub 2007 Jun 1. Int Immunol. 2007. PMID: 17545279
Cited by
-
Combined skin and muscle vaccination differentially impact the quality of effector T cell functions: the CUTHIVAC-001 randomized trial.Sci Rep. 2017 Oct 12;7(1):13011. doi: 10.1038/s41598-017-13331-1. Sci Rep. 2017. PMID: 29026141 Free PMC article. Clinical Trial.
-
Modulating Vaccinia Virus Immunomodulators to Improve Immunological Memory.Viruses. 2018 Feb 28;10(3):101. doi: 10.3390/v10030101. Viruses. 2018. PMID: 29495547 Free PMC article. Review.
-
Cell-Mediated Immunity Generated in Response to a Purified Inactivated Vaccine for Dengue Virus Type 1.mSphere. 2020 Jan 22;5(1):e00671-19. doi: 10.1128/mSphere.00671-19. mSphere. 2020. PMID: 31969476 Free PMC article. Clinical Trial.
-
hPMSCs Regulate the Level of TNF-α and IL-10 in Th1 Cells and Improve Hepatic Injury in a GVHD Mouse Model via CD73/ADO/Fyn/Nrf2 Axis.Inflammation. 2024 Feb;47(1):244-263. doi: 10.1007/s10753-023-01907-1. Epub 2023 Oct 13. Inflammation. 2024. PMID: 37833615
-
Intranasal monkeypox marmoset model: Prophylactic antibody treatment provides benefit against severe monkeypox virus disease.PLoS Negl Trop Dis. 2018 Jun 21;12(6):e0006581. doi: 10.1371/journal.pntd.0006581. eCollection 2018 Jun. PLoS Negl Trop Dis. 2018. PMID: 29927927 Free PMC article.
References
-
- Jenner E.An inquiry into the causes and effects of the variolae vaccinae, a diseases discovered in some of the western countries of England, particularly Gloucestershire . London, UK: printed for the author by Sampson Low and sold by Law and Murray and Highley; 1798. http://pyramid.spd.louisville.edu/~eri/fos/jenner.html . Accessed February 2, 2010.
Publication types
MeSH terms
Substances
LinkOut - more resources
Full Text Sources
Medical
Research Materials
