. 2010 Apr;17(4):423-9.
doi: 10.1038/nsmb.1800. Epub 2010 Apr 4.

Diversity in DNA recognition by p53 revealed by crystal structures with Hoogsteen base pairs

Affiliations

Diversity in DNA recognition by p53 revealed by crystal structures with Hoogsteen base pairs

Malka Kitayner et al. Nat Struct Mol Biol. 2010 Apr.

Abstract

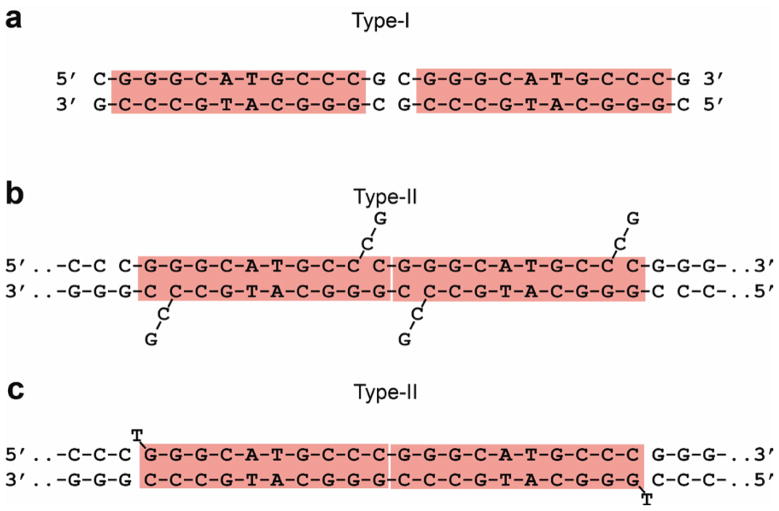
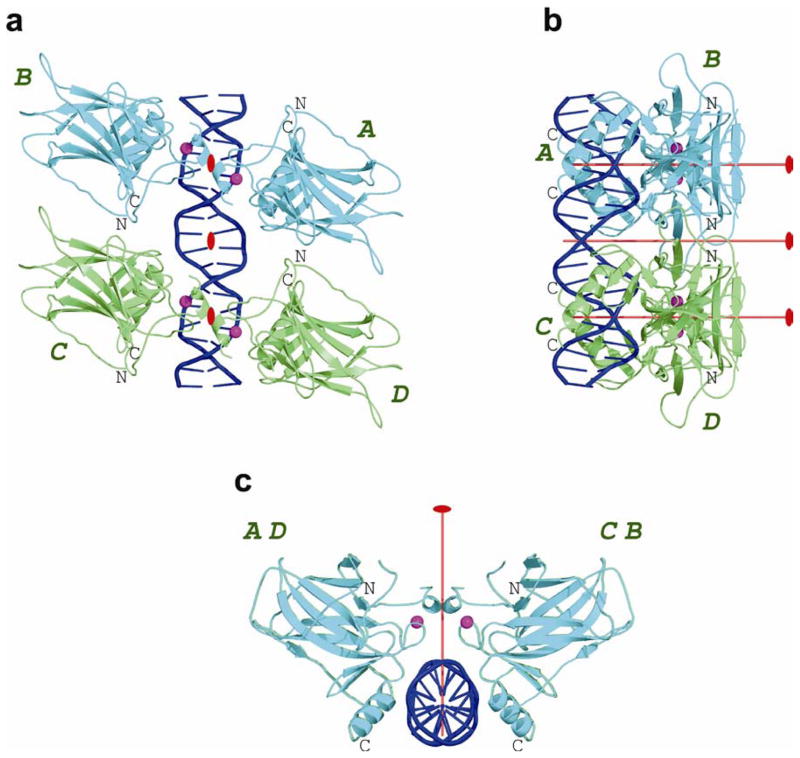
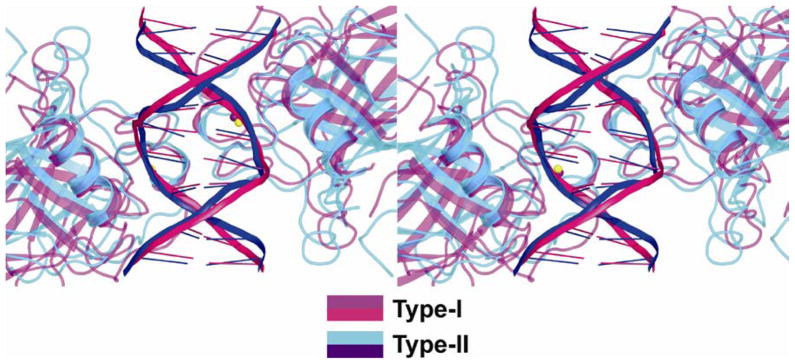
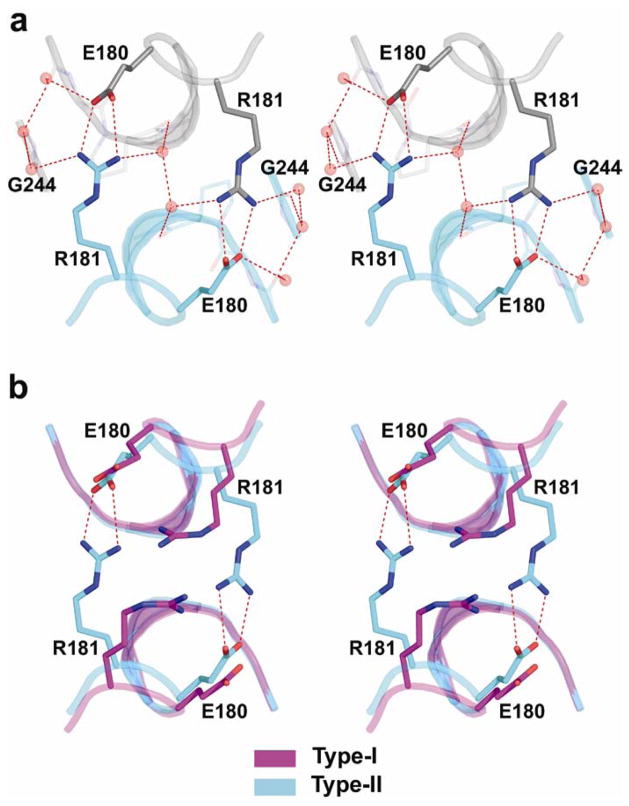
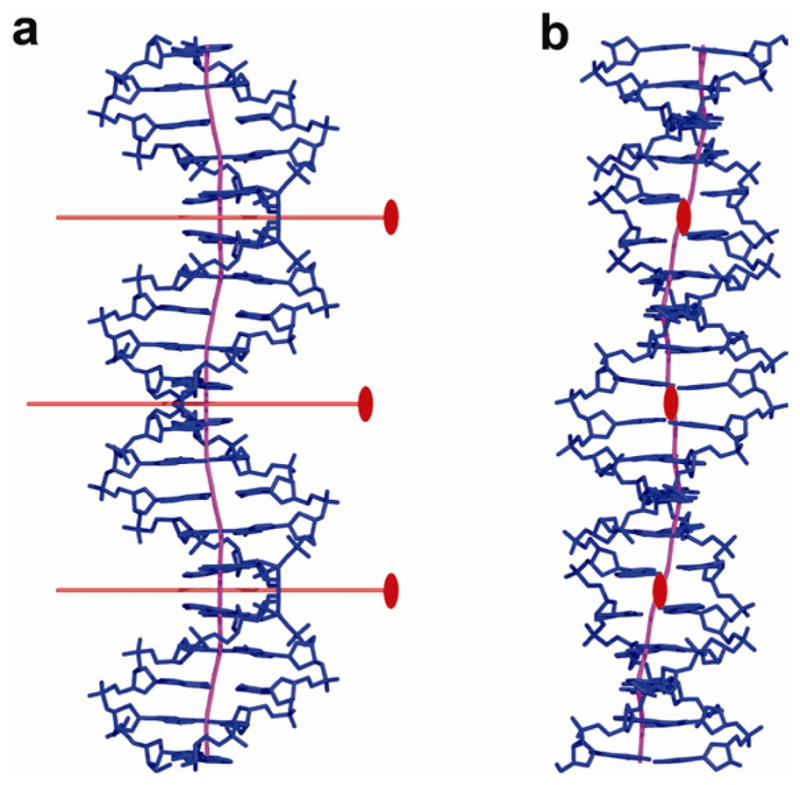
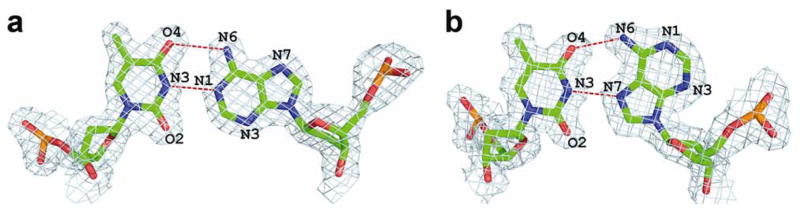
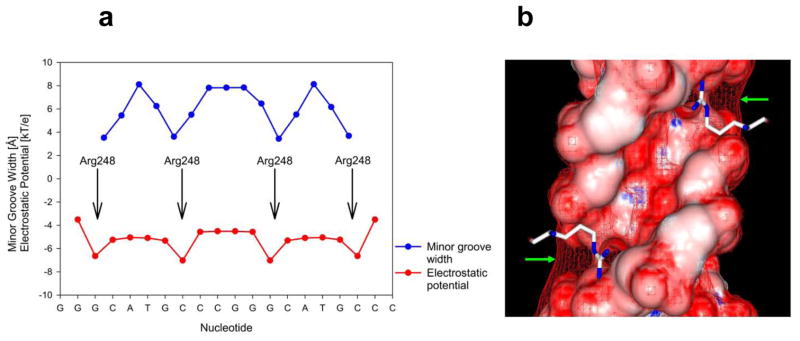
p53 binds as a tetramer to DNA targets consisting of two decameric half-sites separated by a variable spacer. Here we present high-resolution crystal structures of complexes between p53 core-domain tetramers and DNA targets consisting of contiguous half-sites. In contrast to previously reported p53-DNA complexes that show standard Watson-Crick base pairs, the newly reported structures show noncanonical Hoogsteen base-pairing geometry at the central A-T doublet of each half-site. Structural and computational analyses show that the Hoogsteen geometry distinctly modulates the B-DNA helix in terms of local shape and electrostatic potential, which, together with the contiguous DNA configuration, results in enhanced protein-DNA and protein-protein interactions compared to noncontiguous half-sites. Our results suggest a mechanism relating spacer length to protein-DNA binding affinity. Our findings also expand the current understanding of protein-DNA recognition and establish the structural and chemical properties of Hoogsteen base pairs as the basis for a novel mode of sequence readout.


Figures

Figure 1
Figure 1
DNA binding sites of type-I and type-II complexes. (a) Type-I complex formed by DNA dodecamers: the two half-sites are separated by a two base pair spacer. (b) Type-II complexes formed by DNA dodecamers: the two half-sites are contiguous as the two nucleotides at each 3′-end are extrahelical, and the decameric duplexes are stacked end-to-end (complexes 1 and 2 in Table 1). (c) Type-II complex formed by 21-mer DNA oligomers: a 20 base-pair duplex with contiguous half-sites and extrahelical T-nucleotides at each 5′-end (complex 3 in Table 1). Complex 3 is essentially identical in structure to that of complexes 1 and 2.
Figure 2
Figure 2
Overall structure of the p53 core-domain tetramer bound to DNA with contiguous half-sites. (a) Four p53 core domains (designated as A, B, C and D) interact with a 20 base-pair DNA (shown in blue). The core tetramer is a dimer of dimers: A–B (in cyan) and C–D (in green). The four Zn ions are shown as magenta spheres. View down the central dyad of the core tetramer. (b) View perpendicular to the central dyad and the DNA helix axis. (c) View down the DNA helix axis. Also shown in red are the central dyad between dimers and the two local dyads within dimers. The figure is based on the coordinates of complex 3. Amino-acid sequence and secondary structure of the core domain are in Supplementary Fig. 2.
Figure 3
Figure 3
Comparison of p53 core dimers bound to DNA half-sites in type-I and type-II complexes. (a) Superposition of type-I structure (DNA in pink, p53 and Zn ion in magenta) onto type-II structure (DNA in blue, p53 in cyan, Zn ions in yellow) is based on the DNA backbone atoms. The stereo view is down the dyad of the dimer and into the DNA major groove. The view highlights the different DNA conformations and the different arrangements of the p53 molecules on their DNA in type-I and type-II complexes. (b) Stereo view of the salt bridges between residues Glu180 and Arg181 in type-II intra-dimer interface, and the supporting hydration shell, shown within the electron density (2FoFc at 1σ level). Water molecules from the first- hydration shell are shown as red spheres (based on complex 2). (c) Stereo view of the superposition of the same regions in type-I (magenta) and type-II (cyan) complexes. It shows the stacking of the guanidinium groups of arginine residues in type I and the salt bridges in type II as well as the further proximity of the protein backbones in the later relative to the former.
Figure 4
Figure 4
Inter-dimer interfaces. (a) Type-I interface (b) Type-II interface. Two p53 core domains comprising half of the inter-dimer interface are shown in cyan and green (the other half is related by dyad symmetry). The structures of the DNA-bound core domains in type-I and type-II complexes are very similar except for the flexible L1 recognition loop (see Supplementary RESULTS).
Figure 5
Figure 5
Comparison of Hoogsteen and Watson-Crick base pairs. (a) Watson-Crick A/T base pair from type-I complex (PDB ID 2AC0 from ref. ). (b) Hoogsteen A/T base pair from type-II complex. Both are shown within their electron density maps (2FoFc at 1σ level). (c) Stereo view of the superposition of Watson-Crick and Hoogsteen base pairs showing the change in the positions of the glycosidic bonds of the adenine bases and the attached backbones. (d) Stereo view of DNA quarter-sites from type-I and type-II complexes shown in magenta and blue, respectively. It illustrates the change in the backbone trajectory following the Hoogsteen base pair and its effect on the narrowing of the minor groove in type-II helix. The superposition is based on the coordinates of the central T nucleotides of the corresponding half-sites.
Figure 6
Figure 6
DNA helix parameters in type-I and type-II complexes. (a) Variations in helix diameter along the DNA helix (b) Variations in minor-groove width along the DNA helix. Calculations were performed with our in-house version of Curves adapted for Hoogsteen base pairs. The values for the G/C spacer in type-I complex are not shown for clarity.
Figure 7
Figure 7
Recognition of DNA shape and electrostatic potential by Arg248 residues in type-II complexes. (a) The Hoogsteen geometry of the two central A/T base pairs in each half site leads to narrow minor groove regions (blue plot) at the ends of the CATG elements. Groove narrowing results in enhanced negative electrostatic potential (red plots) aligned with the binding sites of the Arg248 side chains. (b) The electrostatic potential mapped onto the molecular surface of one half-site of the binding site (negative potential in red, positive potential in blue). In addition, a red mesh indicates the isoelectrostatic surface at −5 kT e−1. As highlighted by green arrows, the mesh reaches outward the minor groove in the narrow regions, close to the binding sites for the positively charged Arg248 side chains.
Figure 8
Figure 8
Figure 9
Figure 9

Comment in

  • Four p(53)s in a pod.
    Chitayat S, Arrowsmith CH. Chitayat S, et al. Nat Struct Mol Biol. 2010 Apr;17(4):390-1. doi: 10.1038/nsmb0410-390. Nat Struct Mol Biol. 2010. PMID: 20368720 No abstract available.

References

    1. Vogelstein B, Lane D, Levine AJ. Surfing the p53 network. Nature. 2000;408:307–310. - PubMed
    1. Vousden KH, Lu X. Live or let die: the cell’s response to p53. Nat Rev Cancer. 2002;2:594–604. - PubMed
    1. Oren M. Decision making by p53: life, death and cancer. Cell Death Differ. 2003;10:431–42. - PubMed
    1. Laptenko O, Prives C. Transcriptional regulation by p53: one protein, many possibilities. Cell Death Differ. 2006;13:951–61. - PubMed
    1. El-Deiry WS, Kern SE, Pietenpol JA, Kinzler KW, Vogelstein B. Definition of a consensus binding site for p53. Nature Gen. 1992;1:45–49. - PubMed

Publication types

MeSH terms