. 2010 May;42(5):385-91.
doi: 10.1038/ng.564. Epub 2010 Apr 4.

Mutation spectrum revealed by breakpoint sequencing of human germline CNVs

Affiliations

Mutation spectrum revealed by breakpoint sequencing of human germline CNVs

Donald F Conrad et al. Nat Genet. 2010 May.

Abstract

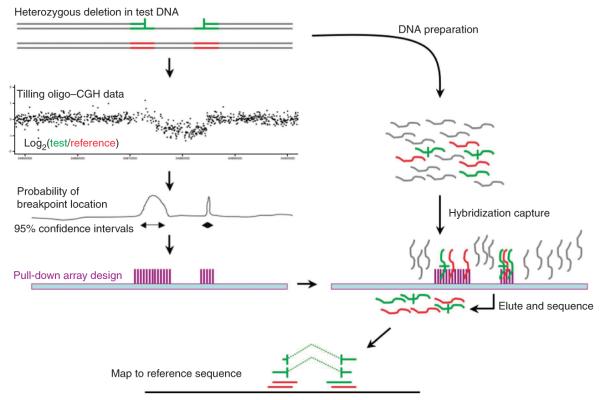
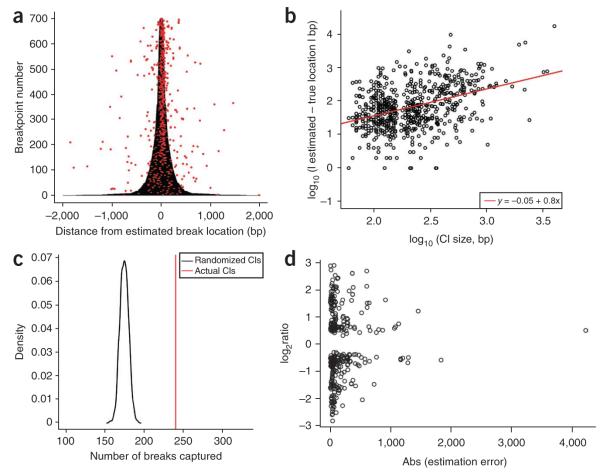
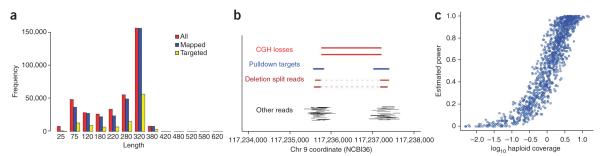
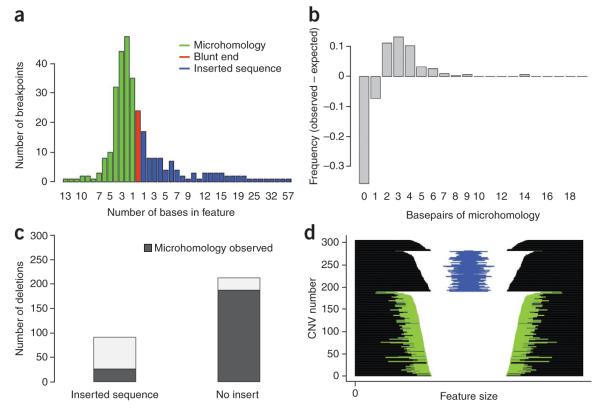
Precisely characterizing the breakpoints of copy number variants (CNVs) is crucial for assessing their functional impact. However, fewer than 10% of known germline CNVs have been mapped to the single-nucleotide level. We characterized the sequence breakpoints from a dataset of all CNVs detected in three unrelated individuals in previous array-based CNV discovery experiments. We used targeted hybridization-based DNA capture and 454 sequencing to sequence 324 CNV breakpoints, including 315 deletions. We observed two major breakpoint signatures: 70% of the deletion breakpoints have 1-30 bp of microhomology, whereas 33% of deletion breakpoints contain 1-367 bp of inserted sequence. The co-occurrence of microhomology and inserted sequence is low (10%), suggesting that there are at least two different mutational mechanisms. Approximately 5% of the breakpoints represent more complex rearrangements, including local microinversions, suggesting a replication-based strand switching mechanism. Despite a rich literature on DNA repair processes, reconstruction of the molecular events generating each of these mutations is not yet possible.


Figures

Figure 1
Figure 1
Experimental overview. This diagram depicts the three stages of the experiment. First, test (green) and reference (red) DNAs are cohybridized to a CGH array. Second, the intensity data generated from the CGH experiment is summarized at each probe and the distribution of probe intensities is used to identify CNVs using the GADA segmentation algorithm. The intensity data are then used to construct confidence intervals around each putative CNV breakpoint. A hybridization-based capture array is designed to these confidence intervals. Third, test and reference samples are cohybridized to the capture array. Fragments with at least partial homology to the target regions are preferentially retained and sequenced. Sequence reads are mapped to the genome; reads without CNV breakpoints show contiguous homology to the reference across all bases, whereas reads containing breakpoints appear to be split, with partial homology to either side of the CNV.
Figure 2
Figure 2
Confidence intervals. (a) We used our array CGH data to construct confidence intervals for both the 5′ and 3′ breakpoints of 350 CNVs with published breakpoint sequences. m2 confidence intervals (shown here as 700 horizontal gray lines) are drawn in base pairs 5′ or 3′ (<0 or >0, respectively) from the GADA-estimated breakpoint location. The true location for each sequenced breakpoint is represented as a red dot. There appears to be a strong positive correlation between confidence interval size and the accuracy of the GADA breakpoint estimates, indicating the CGH data contains useful information on the uncertainty in breakpoint location. (b) We confirmed this by modeling the relationship between confidence interval size and the accuracy of our breakpoint estimates. The best-fit line from least-squares regression is shown in red (test of slope = 0, P < 10−15). (c) A permutation test of the hypothesis that our confidence intervals cover more breakpoint locations than expected by chance. As our test statistic, we used the number of true breakpoints covered by a set of confidence intervals. A null distribution for this statistic was generated using 1,000 permutations of m1 confidence intervals across CNVs (shown here as a black curve). The number of true breakpoints covered with the correctly assigned confidence intervals (indicated by a vertical red line) was 13 s.d. greater than the mean from the randomly assigned permutations. (d) The relationship between CNV log2 ratio between test and reference in the discovery CGH experiment and the breakpoint estimation error indicate that GADA breakpoint estimation accuracy decreases as the CNV signal is closer to the background.
Figure 3
Figure 3
Properties of the pulldown experiment. (a) Distribution of read lengths for all sequences, mapped sequences, and mapped and targeted sequences. (b) Integration of CGH data, confidence intervals and short-read sequencing facilitates rapid identification of CNV breakpoints. Shown here is an overview of the data for a deletion observed twice in the CGH experiment and then successfully recovered by split-read analysis. (c) Power of the pulldown experiment to identify breakpoints for 1,185 validated, non-VNTR loci, plotted as a function of haploid sequence coverage. According to power simulations, the single best predictor of breakpoint sequencing success of non-VNTR loci was sequence coverage of the target region (Pearson R = 0.78). Using the BLAT pipeline, we estimated that our approach has 90% power to sequence a CNV breakpoint when both target regions of the CNV have an average of twofold haploid sequence coverage (Online Methods and Supplementary Methods).
Figure 4
Figure 4
Summary of sequence content at deletion breaks. (a) Histogram summarizing the number of breakpoints showing blunt ends (red), microhomology (blue) or inserted sequence (red). For each class of breakpoint, events are binned by the number of bases in each feature; in the case of blunt ends, all events are in the same bin of 0 bases. (b) Nonrandom distribution of microhomology observed at deletion breakpoints. We derived an expected distribution of microhomology length by simulating random breakpoints while conditioning on the base content of CNV breakpoint regions. Here we have plotted the difference between the observed and expected amount of microhomology for our deletion breakpoints, which reveals two notable features of our data: (i) there are more deletion breakpoints showing microhomology than expected by chance; (ii) conditional on the presence of microhomology, there is an enrichment of breakpoints with 2–9 bases of microhomology. (c) The presence of inserted sequence within deletion breakpoints is more common in the absence of microhomology (P < 10−15, χ2 test). (d) Each deletion sequenced in the pulldown experiment is represented with a horizontal line. The deletions are parsed by sequence features into three groups: the top group shows no microhomology or inserted sequence, the second group shows at least 1 bp of inserted sequence, represented by a blue line, and the third groups shows at least 1 bp of microhomology at the breakpoints, represented by green lines. CNVs and sequence features are plotted on a log scale, and CNVs are sorted by size within groups.
Figure 5
Figure 5
Inverted sequence at complex CNV breakpoints. These schematic homology plots summarize into four classes the 12 cases of deletions with inverted sequence we observed. The plots represent the regions of similarity and orientation of these sequences within the CNV region as if we had plotted a dot plot of the reference (x axis) against the new allelic structure from assembly of the 454 reads (y axis). Sequences inverted within the new allele relative to the reference are colored red and orange; those in the same orientation are blue and purple. The black loops represent the deleted sequence. (a) A deletion plus an inverted sequence originating from within the larger deleted region; n = 8. (b) Deletion plus inverted sequence originating from the local vicinity; n = 2. (c) Deletion plus inverted sequence originating from the local vicinity, but owing to an incomplete assembly it is not clear whether it comes from within or outside the deletion region; n = 2. (d) In a single case, a deletion plus two separate inversions with sequence originating from the local vicinity of the breakpoint.

Comment in

References

    1. Mills RE, et al. An initial map of insertion and deletion (INDEL) variation in the human genome. Genome Res. 2006;16:1182–1190. - PMC - PubMed
    1. Levy S, et al. The diploid genome sequence of an individual human. PLoS Biol. 2007;5:e254. - PMC - PubMed
    1. Kim PM, et al. Analysis of copy number variants and segmental duplications in the human genome: evidence for a change in the process of formation in recent evolutionary history. Genome Res. 2008;18:1865–1874. - PMC - PubMed
    1. Wyman C, Kanaar R. DNA double-strand break repair: all’s well that ends well. Annu. Rev. Genet. 2006;40:363–383. - PubMed
    1. Hastings PJ, Lupski JR, Rosenberg SM, Ira G. Mechanisms of change in gene copy number. Nat. Rev. Genet. 2009;10:551–564. - PMC - PubMed

Publication types