. 2010 May;42(5):420-5.
doi: 10.1038/ng.563. Epub 2010 Apr 4.

Genome-wide association study of intracranial aneurysm identifies three new risk loci

Affiliations

Genome-wide association study of intracranial aneurysm identifies three new risk loci

Katsuhito Yasuno et al. Nat Genet. 2010 May.

Abstract

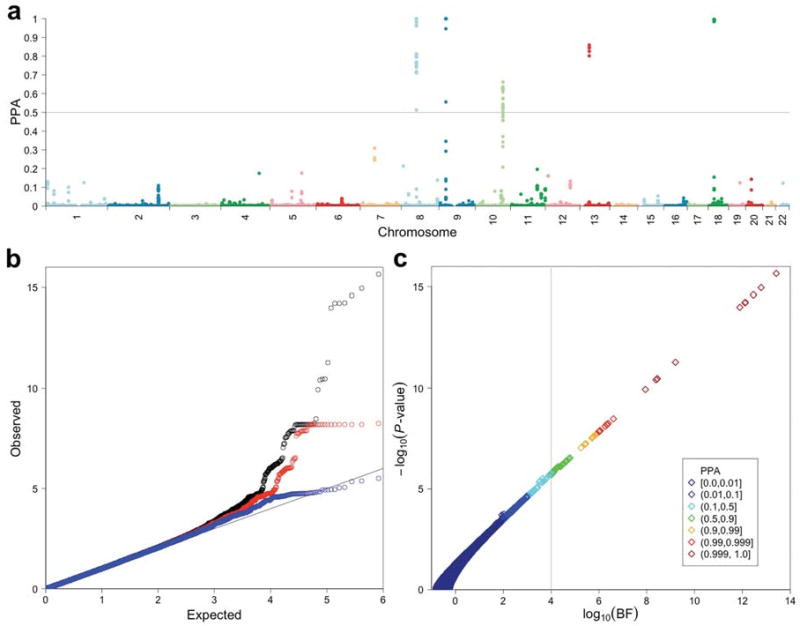
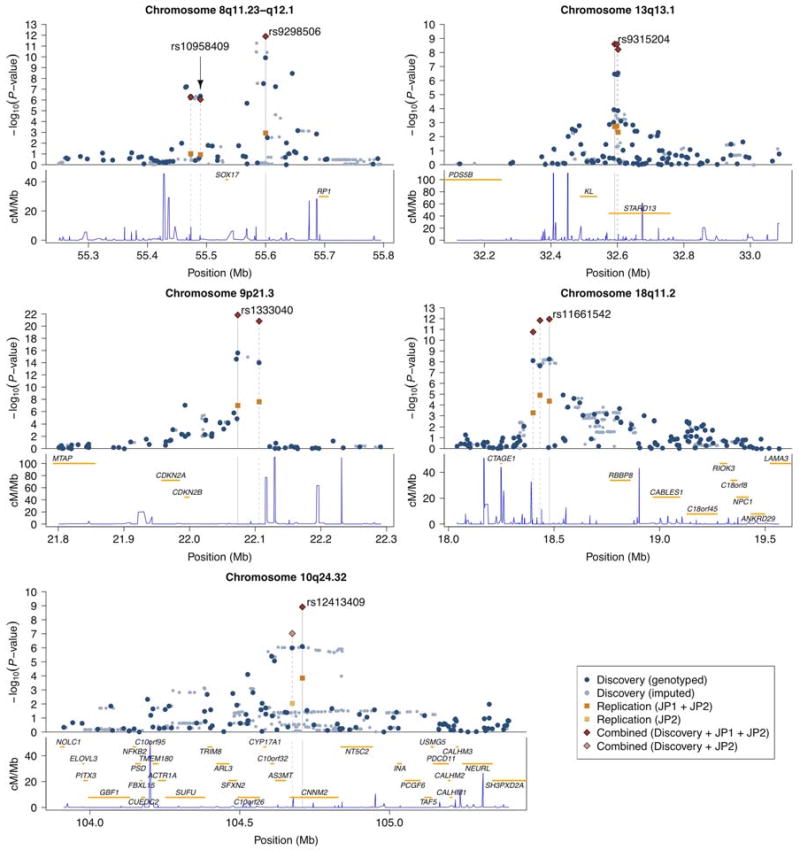
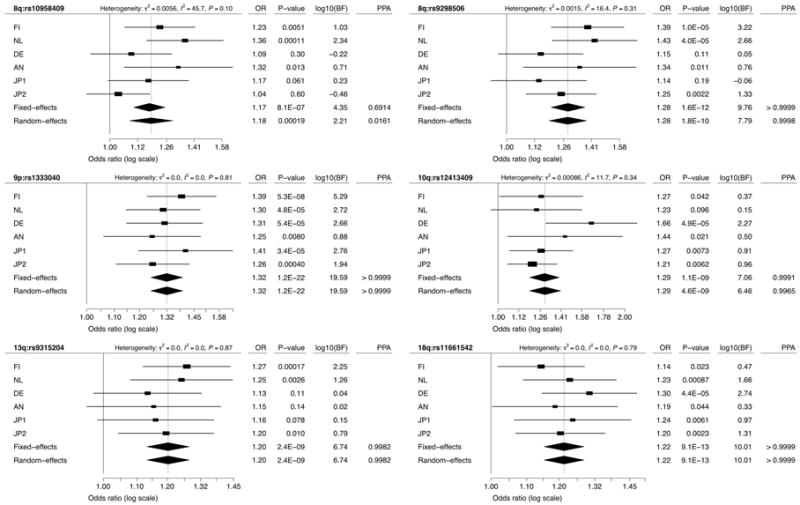
Saccular intracranial aneurysms are balloon-like dilations of the intracranial arterial wall; their hemorrhage commonly results in severe neurologic impairment and death. We report a second genome-wide association study with discovery and replication cohorts from Europe and Japan comprising 5,891 cases and 14,181 controls with approximately 832,000 genotyped and imputed SNPs across discovery cohorts. We identified three new loci showing strong evidence for association with intracranial aneurysms in the combined dataset, including intervals near RBBP8 on 18q11.2 (odds ratio (OR) = 1.22, P = 1.1 x 10(-12)), STARD13-KL on 13q13.1 (OR = 1.20, P = 2.5 x 10(-9)) and a gene-rich region on 10q24.32 (OR = 1.29, P = 1.2 x 10(-9)). We also confirmed prior associations near SOX17 (8q11.23-q12.1; OR = 1.28, P = 1.3 x 10(-12)) and CDKN2A-CDKN2B (9p21.3; OR = 1.31, P = 1.5 x 10(-22)). It is noteworthy that several putative risk genes play a role in cell-cycle progression, potentially affecting the proliferation and senescence of progenitor-cell populations that are responsible for vascular formation and repair.


Figures

Figure 1
Figure 1. Genome-wide association analysis results in the discovery cohort
(a) The posterior probabilities of association (PPAs) for 831,532 QC-passed SNPs analyzed specifying a prior probability of association of 1/10,000 are plotted against genomic locations of SNPs. A gray horizontal line at PPA = 0.5 indicates the cutoff value for follow-up genotyping. (b) Quantile-quantile (QQ) plots of P-values (−log10 scale) are shown for: all the SNPs analyzed (black; n = 831,532); SNPs after excluding those within previously identified regions (red; n = 830,907); SNPs after excluding all within the final associated intervals (blue; n = 830,158). (c) A scatter plot of −log10 P-values vs. log10 Bayes factors (BFs) is shown with color for each point indicating the range of PPA. There are very close relationships among the P-value for association, the BF and PPA. Note that, given a uniform prior probability of association, the PPA increases as the BF increases. A vertical line indicates the minimum PPA threshold at 0.5 (BF = 1.0×10⁴) for follow-up.
Figure 2
Figure 2. Regional plots for associated regions
For each chromosomal interval, −log10 P-values for association are plotted against the genomic coordinates (NCBI build 36) in the upper panel; the recombination rates obtained from the HapMap database and the RefSeq genes (hg18) within the regions are shown in the lower panel. In the upper panel, rs identifiers of SNPs listed in Table 2 are shown and their positions are indicated by gray vertical lines. Gray dashed lines indicate locations of other SNPs genotyped in the replication cohorts. Dark blue and light blue dots represent results of genotyped and imputed SNPs for the discovery cohort, respectively; orange and light orange squares represent association results for the replication cohort using JP1 plus JP2 and JP2-only, respectively; combined results for SNPs genotyped both in the discovery and the replication cohort using JP1 plus JP2 and JP2-only are shown by red and light red diamonds, respectively.
Figure 3
Figure 3. Consistency of association across cohorts
Forest plots are shown for meta-analysis of SNPs listed in Table 2. Squares and horizontal segments represent estimated per-allele odds ratios (ORs) and 95% confidence intervals (CIs) for individual cohorts. Diamonds represent the summary OR estimates and 95% CIs for the meta-analyses of 6 cohorts (fixed- and random-effects models). log10(BF) > 0 supports association with IA, while log10(BF) < 0 supports no association with IA. Analyzing the results here as 6 distinct cohorts rather than 4 (as in the primary analysis) results in only minor differences, due to different weights given to sub-cohorts of the combined European cohort (CE) associated with genomic control correction.

References

    1. Rinkel GJ, Djibuti M, Algra A, van Gijn J. Prevalence and risk of rupture of intracranial aneurysms: a systematic review. Stroke. 1998;29:251–6. - PubMed
    1. Bilguvar K, et al. Susceptibility loci for intracranial aneurysm in European and Japanese populations. Nat Genet. 2008;40:1472–7. - PMC - PubMed
    1. Iwamoto H, et al. Prevalence of intracranial saccular aneurysms in a Japanese community based on a consecutive autopsy series during a 30-year observation period. The Hisayama study. Stroke. 1999;30:1390–5. - PubMed
    1. Salmela E, et al. Genome-wide analysis of single nucleotide polymorphisms uncovers population structure in Northern Europe. PLoS One. 2008;3:e3519. - PMC - PubMed
    1. Jakkula E, et al. The genome-wide patterns of variation expose significant substructure in a founder population. Am J Hum Genet. 2008;83:787–94. - PMC - PubMed

Publication types