. 2010 May;13(5):551-8.
doi: 10.1038/nn.2527. Epub 2010 Apr 4.

The exon junction complex component Magoh controls brain size by regulating neural stem cell division

Affiliations

The exon junction complex component Magoh controls brain size by regulating neural stem cell division

Debra L Silver et al. Nat Neurosci. 2010 May.

Abstract

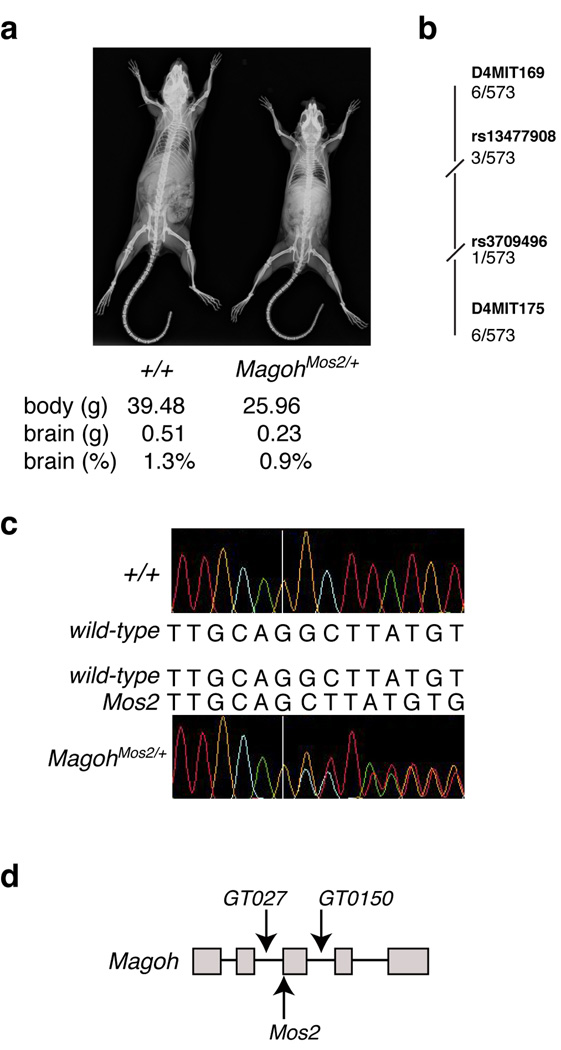
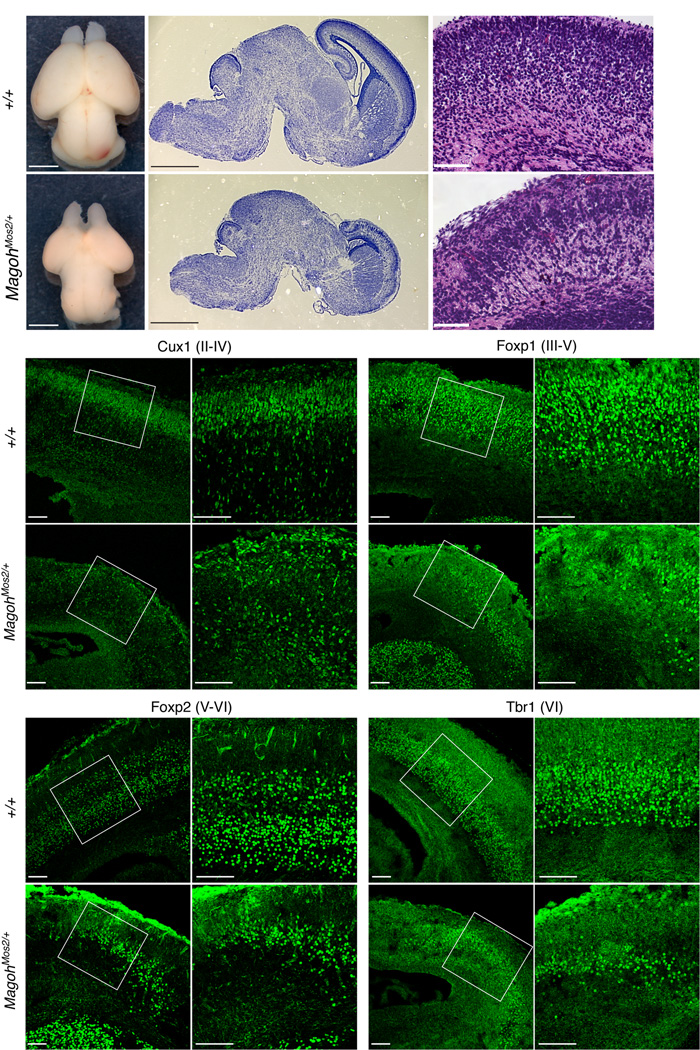
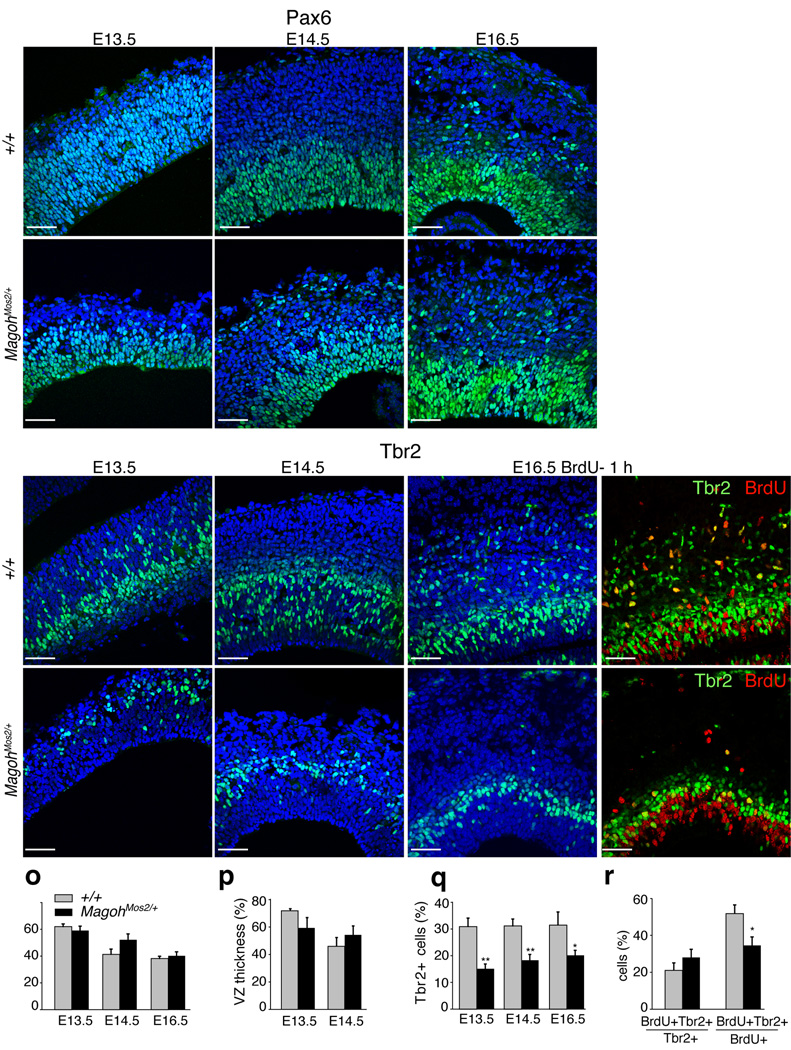
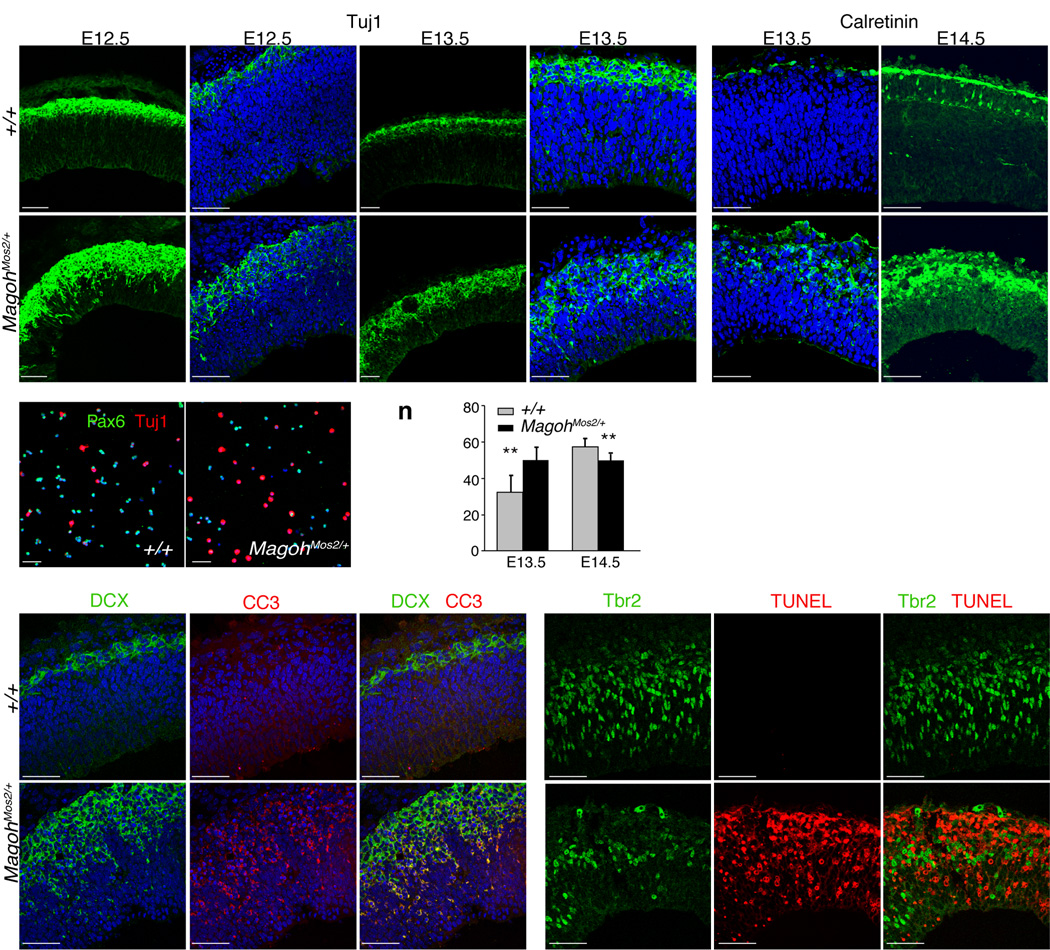
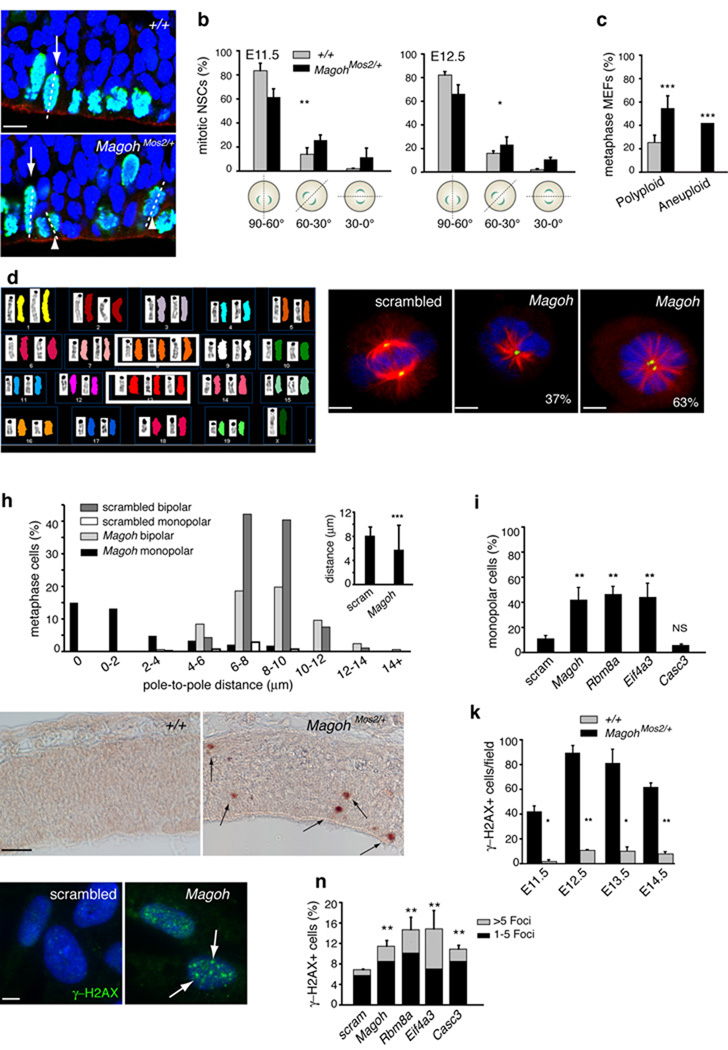
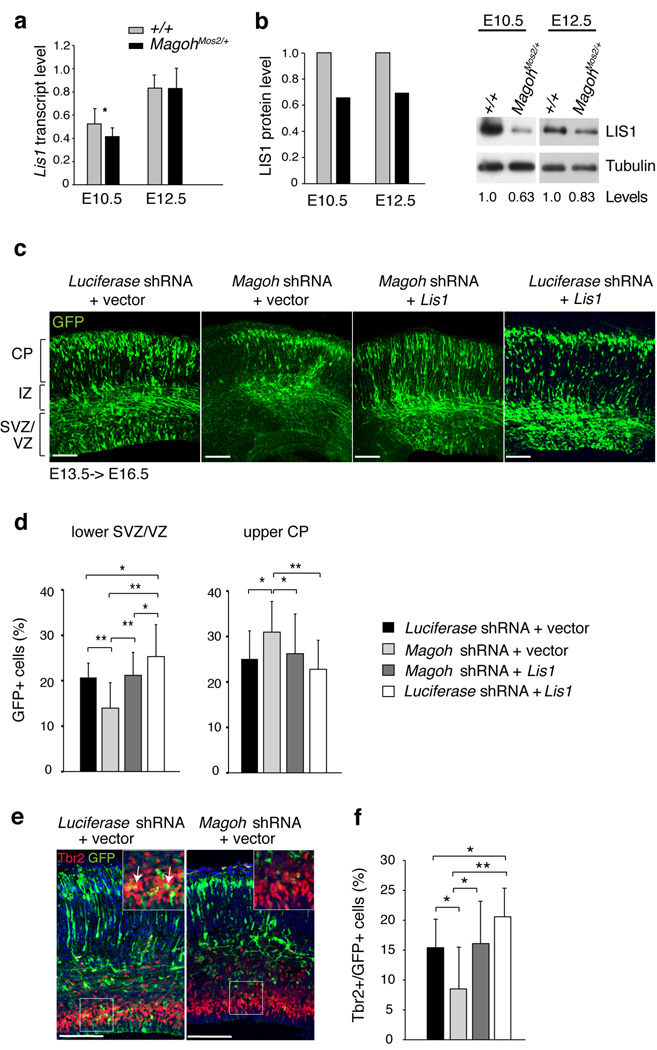
Brain structure and size require precise division of neural stem cells (NSCs), which self-renew and generate intermediate neural progenitors (INPs) and neurons. The factors that regulate NSCs remain poorly understood, and mechanistic explanations of how aberrant NSC division causes the reduced brain size seen in microcephaly are lacking. Here we show that Magoh, a component of the exon junction complex (EJC) that binds RNA, controls mouse cerebral cortical size by regulating NSC division. Magoh haploinsufficiency causes microcephaly because of INP depletion and neuronal apoptosis. Defective mitosis underlies these phenotypes, as depletion of EJC components disrupts mitotic spindle orientation and integrity, chromosome number and genomic stability. In utero rescue experiments showed that a key function of Magoh is to control levels of the microcephaly-associated protein Lis1 during neurogenesis. Our results uncover requirements for the EJC in brain development, NSC maintenance and mitosis, thereby implicating this complex in the pathogenesis of microcephaly.


Figures

Figure 1
Figure 1. Mutation of Magoh causes microcephaly and reduced body size
a, X-ray images of control and MagohMos2/+ adult mice. Average body size (g), brain size (g), and brain size as a percentage of total body weight is listed beneath each genotype. b, Representation of linkage analysis on chromosome 4 with the indicated SNPs and SSLPs (bold) and the number of recombinants/meioses evaluated. For all markers shown, P<0.0005. c, Sequence chromatogram and corresponding sequences of control (top) and MagohMos2/+(bottom) genomic DNA. The MagohMos2/+ DNA sequence contains a G deletion (right of the white line), and from this position onward two peaks are apparent, representing the control and Mos2 alleles. d, Schematic representation of Magoh gene, with exons (grey boxes), introns (lines, not drawn to scale), and locations of three alleles indicated.
Figure 2
Figure 2. E18.5 MagohMos2/+ brains contain disorganized layers and reduced neurons
a,d, Whole mount brains, b,e, Nissl stained sagittal sections, and c,f, H & E stained coronal sections from indicated genotypes. g–v, Confocal micrographs of coronal sections from indicated genotypes stained with antibodies against Cux1 (g,h,k,l), Foxp1 (i,j,m,n), Foxp2 (o,p,s,r), and Tbr1 (q,r,u,v). The neuronal layers they mark are in parentheses. The boxes in g,i,k,m,o,q,s, and u indicate the regions shown in h,j,l,n,p,r,t, and v, respectively. Scale bars, 1 mm (a,b,d,e), 100 µm (c, f, g–v).
Figure 3
Figure 3. Magoh is required for proper numbers of INPs but not NSCs
a–n, Confocal micrographs of coronal sections from indicated genotypes and ages stained with DAPI (blue) and antibodies against Pax6 (green) (a–f), Tbr2 (green) (g–n), and BrdU (red) (j,n). o, Graph depicting the percentage of total DAPI cells that are Pax6+ from indicated genotypes at E13.5, E14.5, and E16.5. p, Graph depicting the thickness of the ventricular zone (VZ), as a percentage of total cortical thickness, from indicated genotypes at E13.5 and E14.5. q, Graph depicting the percentage of total DAPI cells that are Tbr2+ from indicated genotypes at E13.5, E14.5, and E16.5. r, Graph depicting the percentage of Tbr2+ cells that are BrdU+ (left) and the percentage of BrdU+ cells that are Tbr2+ (right). Pregnant females were dissected 1 hour after BrdU injection. For (o,p,q,r) the average values for all embryos (n=2–4 per genotype, 4–5 sections per embryo) is shown, quantitated within a 318 µm2 field. No asterisk indicates no significant differences were observed. *, P<0.05, **, P<0.005; Error bars, s.d. Scale bar (a) all images, 50µm.
Figure 4
Figure 4. Magoh is required to prevent premature neuronal differentiation and apoptosis
a–l, Low magnification (a,c,g,i) and high magnification (b,d,e,f,h,j,k,l) confocal micrographs of coronal sections from indicated genotypes and ages, stained for Tuj1 (green) and DAPI (blue) (a–d,g–j), and Calretinin (green) and DAPI (blue) (e,f,k,l). m, Confocal micrographs of dissociated E12.5 cortical cells from indicated genotypes stained for Pax6 (green), Tuj1 (red), and DAPI (blue). n, Graph depicting the thickness of the cortical plate (CP) and intermediate zone (IZ), as a percentage of total cortical thickness. The average value for all embryos (n=3–4 per genotype, 4–5 sections per embryo) is shown, quantitated within a 318 µm2 field. o–q, u–w, Confocal micrographs of E12.5 coronal sections of indicated genotypes stained for DCX (green) (o,u), CC3 (red) (p,v), DCX (green), CC3 (red) (q,w). r–t, x–z, Confocal micrographs of E14.5 coronal sections of indicated genotypes stained for Tbr2 (green) (r,x), TUNEL (red) (s,y), Tbr2 (green), TUNEL (red) (t,z). **, P<0.005; Error bars, s.d. Scale bars, 50 µm.
Figure 5
Figure 5. Magoh and core EJC components regulate the mitotic spindle, ploidy, mitosis, and genomic stability
a, Confocal micrographs of E11.5 coronal sections stained with DAPI (blue), rhodamine phalloidin (red) and for PH3 (green), with metaphase cells dividing vertically (arrows), and with intermediate orientation (arrowheads) indicated. b,c, Graphs depicting percentage of NSCs exhibiting indicated mitotic cleavage planes at E11.5 (left) and E12.5 (right) (b) and MEFs exhibiting polyploidy and aneuploidy (c). d, Representative SKY image from MagohMos2/+ MEF depicting aneuploidy (3 copies of chromosomes 8, 13). e–g, Confocal micrographs of HeLa cells treated with scrambled (e) and Magoh(f,g) siRNA, and stained with DAPI (blue), for α-Tubulin (green) and γ-Tubulin (red). Percentages indicate Magoh siRNA-treated monopolar cells containing one (f) or two (g) centrosomes. h, Graphs depicting percentages of siRNA-treated metaphase cells exhibiting indicated pole-to-pole distances, for bipolar and monopolar cells independently (left) and together (inset). i, Graph depicting percentages of siRNA-treated cells that are monopolar. j, Images of E11.5 coronal sections stained for γ-H2AX (brown, arrows). k, Graph depicting γ-H2AX+ cells at indicated ages. l,m, Images of siRNA-treated RPE cells stained with DAPI (blue) and for γ-H2AX+ foci (green, arrows). n, Graph depicting percentages of siRNA-treated RPE cells exhibiting >5 γ-H2AX+ (grey) and 1–5 γ-H2AX+ (black) foci. Graphs indicate average values for 2–4 embryos per genotype (b,c,k), for all siRNA-treated cells (h), and for 3–6 independent experiments (i,n). *, P<0.05, **, P<0.005, ***, P<0.0005; Error bars, s.d.; Scale bars, 5 µm (e, f, g), 10 µm (a,m), 50 µm (l).
Figure 6
Figure 6. Magoh acts upstream of the microcephaly-associated protein LIS1 to regulate neurogenesis
a,b, Graphs representing Lis1 gene expression measured by quantitative PCR (a) and LIS1 protein expression measured from Western blot analyses (b). b, Representative cropped Western blots of cortical lysates from indicated ages and genotypes, probed with antibodies against LIS1 (46 kDa) and α-Tubulin (55 kDa) as a loading control. Below the lanes are densitometry values normalized for loading, with control normalized to 1.0. The full-length blots are presented in Supplementary Fig. 8e. c, Confocal micrographs of coronal sections from E16.5 brains in utero co-electroporated at E13.5 with pCAG-GFP (green) and the following: Luciferase shRNA + vector, Magoh shRNA + vector, Magoh shRNA + Lis1 Luciferase shRNA + Lis1. Note that in Magoh shRNA + vector brains there are fewer GFP+ cells in the SVZ/VZ layers. d, Graph depicting the percentage of GFP+ cells in lower SVZ/VZ and upper CP layers of the brain for indicated in utero electroporations. e, Confocal micrographs of brains from indicated in utero electroporations showing GFP (green) and stained for Tbr2 (red) and DAPI (blue). The inset shows a higher magnification view of the boxed region, depicting co-localization (yellow) of Tbr2 (red) and GFP (green). f, Graph depicting the percentage of GFP+ cells that express Tbr2 for indicated in utero electroporations. Graphs in (d,f) show averages of all sections. *, P<0.05, **, P<0.005; Error bars, s.d.; Scale bars, 100 µm.

Comment in

  • Regulating brain size.
    Dave KA. Dave KA. Nat Neurosci. 2010 May;13(5):531. doi: 10.1038/nn0510-531. Nat Neurosci. 2010. PMID: 20421899 No abstract available.

References

    1. Molyneaux BJ, Arlotta P, Menezes JR, Macklis JD. Neuronal subtype specification in the cerebral cortex. Nat Rev Neurosci. 2007;8:427–437. - PubMed
    1. Haubensak W, Attardo A, Denk W, Huttner WB. Neurons arise in the basal neuroepithelium of the early mammalian telencephalon: a major site of neurogenesis. Proc Natl Acad Sci USA. 2004;101:3196–3201. - PMC - PubMed
    1. Pontious A, Kowalczyk T, Englund C, Hevner RF. Role of intermediate progenitor cells in cerebral cortex development. Dev Neurosci. 2008;Vol. 30:24–32. - PubMed
    1. Chenn A, McConnell SK. Cleavage orientation and the asymmetric inheritance of Notch1 immunoreactivity in mammalian neurogenesis. Cell. 1995;82:631–641. - PubMed
    1. Sanada K, Tsai LH. G protein betagamma subunits and AGS3 control spindle orientation and asymmetric cell fate of cerebral cortical progenitors. Cell. 2005;122:119–131. - PubMed

Publication types

MeSH terms

Associated data