

Human immunodeficiency virus-1 evolutionary patterns associated with pathogenic processes in the brain
- PMID: 20367240
- PMCID: PMC2994721
- DOI: 10.3109/13550281003735709
Human immunodeficiency virus-1 evolutionary patterns associated with pathogenic processes in the brain
Abstract
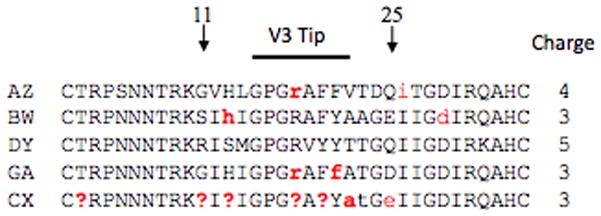
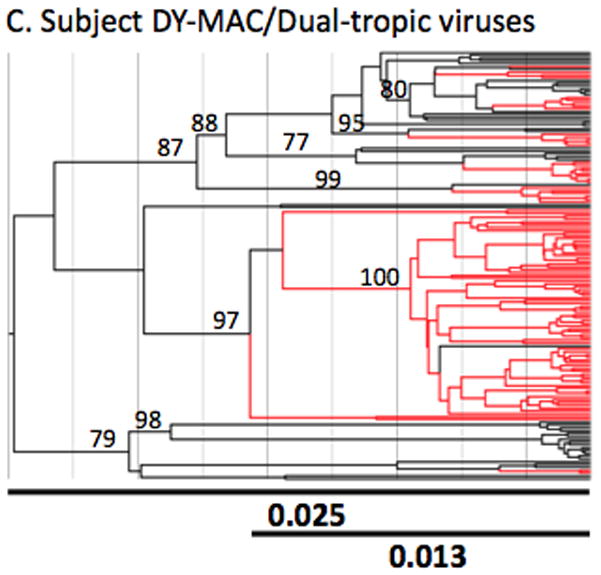
The interplay between pathology and human immunodeficiency virus (HIV) expansion in brain tissues has not been thoroughly assessed in the highly active antiretroviral therapy (HAART) era. HIV-associated dementia (HAD) is marked by progressive brain infection due to recruitment and migration of macrophages in brain tissues; however, the cellular and viral events occurring prior to HAD development and death are under debate. In this study, 66 brain tissues from 11 autopsies were analyzed to assess HIV-1 DNA concentration in brain tissues. In most patients without HAD, it was impossible to amplify HIV-1 from brain tissues. Amplifiable DNA was obtained from three cases of patients on HAART who died due to primary pathology other than HAD: (1) cardiovascular disease, a disease associated with HAART therapy; (2) bacterial infections, including Mycobacterium avium complex, rapid occurrence of extreme dementia; and (3) acquired immunodeficiency syndrome (AIDS)-related lymphoma with meningeal involvement. HIV-1 DNA was also amplified from multiple tissues of two HAD patients. Analysis of HIV-1 nef, gp120, and gp41 sequences showed reduced viral evolution within brain tissues for the non-HAD cases relative to patients with clinical and histological HAD. The present study is the first to show a potential correlation between HIV-1 evolutionary patterns in the brain and different neuropathologies.
Figures


Similar articles
-
Brain-specific HIV Nef identified in multiple patients with neurological disease.J Neurovirol. 2018 Feb;24(1):1-15. doi: 10.1007/s13365-017-0586-0. Epub 2017 Oct 23. J Neurovirol. 2018. PMID: 29063512 Free PMC article.
-
Neuronal death induced by brain-derived human immunodeficiency virus type 1 envelope genes differs between demented and nondemented AIDS patients.J Virol. 1998 Nov;72(11):9045-53. doi: 10.1128/JVI.72.11.9045-9053.1998. J Virol. 1998. PMID: 9765449 Free PMC article.
-
Circular forms of unintegrated human immunodeficiency virus type 1 DNA and high levels of viral protein expression: association with dementia and multinucleated giant cells in the brains of patients with AIDS.J Virol. 1997 Apr;71(4):2928-33. doi: 10.1128/JVI.71.4.2928-2933.1997. J Virol. 1997. PMID: 9060651 Free PMC article.
-
Interactions of human immunodeficiency virus-1 proteins with neurons: possible role in the development of human immunodeficiency virus-1-associated dementia.Eur J Clin Invest. 2002 Aug;32(8):619-27. doi: 10.1046/j.1365-2362.2002.01029.x. Eur J Clin Invest. 2002. PMID: 12190962 Review.
-
HIV-Associated Neurotoxicity: The Interplay of Host and Viral Proteins.Mediators Inflamm. 2021 Aug 25;2021:1267041. doi: 10.1155/2021/1267041. eCollection 2021. Mediators Inflamm. 2021. PMID: 34483726 Free PMC article. Review.
Cited by
-
Mutations at tyrosine 88, lysine 92 and tyrosine 470 of human dopamine transporter result in an attenuation of HIV-1 Tat-induced inhibition of dopamine transport.J Neuroimmune Pharmacol. 2015 Mar;10(1):122-35. doi: 10.1007/s11481-015-9583-3. Epub 2015 Jan 22. J Neuroimmune Pharmacol. 2015. PMID: 25604666 Free PMC article.
-
Intranasal drug delivery of small interfering RNA targeting Beclin1 encapsulated with polyethylenimine (PEI) in mouse brain to achieve HIV attenuation.Sci Rep. 2017 May 12;7(1):1862. doi: 10.1038/s41598-017-01819-9. Sci Rep. 2017. PMID: 28500326 Free PMC article.
-
Novel Allosteric Modulator Southern Research Institute-32743 Reverses HIV-1 Transactivator of Transcription-Induced Increase in Dopamine Release in the Caudate Putamen of Inducible Transactivator of Transcription Transgenic Mice.J Pharmacol Exp Ther. 2023 Feb;384(2):306-314. doi: 10.1124/jpet.122.001291. Epub 2022 Dec 1. J Pharmacol Exp Ther. 2023. PMID: 36456195 Free PMC article.
-
[3H]Dopamine Uptake through the Dopamine and Norepinephrine Transporters is Decreased in the Prefrontal Cortex of Transgenic Mice Expressing HIV-1 Transactivator of Transcription Protein.J Pharmacol Exp Ther. 2020 Aug;374(2):241-251. doi: 10.1124/jpet.120.266023. Epub 2020 May 27. J Pharmacol Exp Ther. 2020. PMID: 32461322 Free PMC article.
-
Envelope gene evolution and HIV-1 neuropathogenesis.J Neuroinfect Dis. 2015 Oct;6(Suppl 2):003. doi: 10.4172/2314-7326.S2-003. Epub 2015 Aug 20. J Neuroinfect Dis. 2015. PMID: 27135036 Free PMC article.
References
-
- Alkhatib G, Combadiere C, Broder CC, Feng Y, Kennedy PE, Murphy PM, Berger EA. CC CKR5: a RANTES, MIP-1alpha, MIP-1beta receptor as a fusion cofactor for macrophage-tropic HIV-1. Science. 1996;272:1955–8. - PubMed
-
- Deng H, Liu R, Ellmeier W, Choe S, Unutmaz D, Burkhart M, Di Marzio P, Marmon S, Sutton RE, Hill CM, Davis CB, Peiper SC, Schall TJ, Littman DR, Landau NR. Identification of a major co-receptor for primary isolates of HIV-1. 1996;381:661–6. - PubMed
Publication types
MeSH terms
Substances
Grants and funding
LinkOut - more resources
Full Text Sources
