. 2009 Nov 4;1(5):5ra13.
doi: 10.1126/scitranslmed.3000111.

Serum amyloid P inhibits fibrosis through Fc gamma R-dependent monocyte-macrophage regulation in vivo

Affiliations

Serum amyloid P inhibits fibrosis through Fc gamma R-dependent monocyte-macrophage regulation in vivo

Ana P Castaño et al. Sci Transl Med. .

Erratum in

  • Sci Transl Med. 2009 Nov 4;1(5):5ra13

Abstract

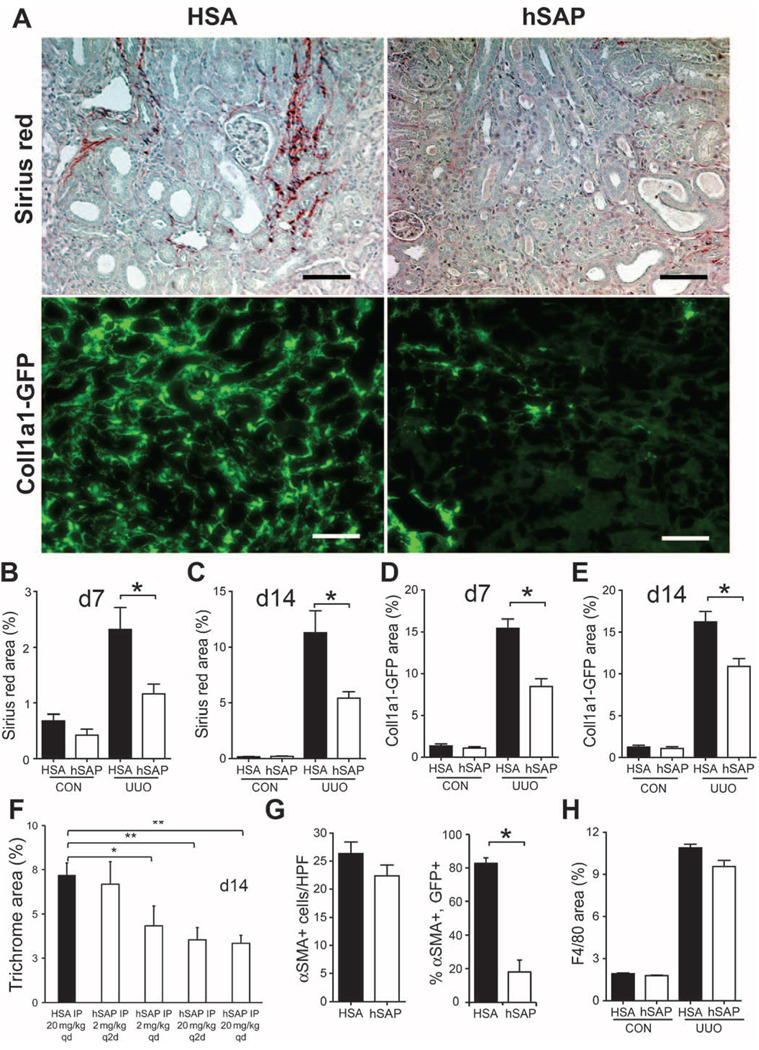
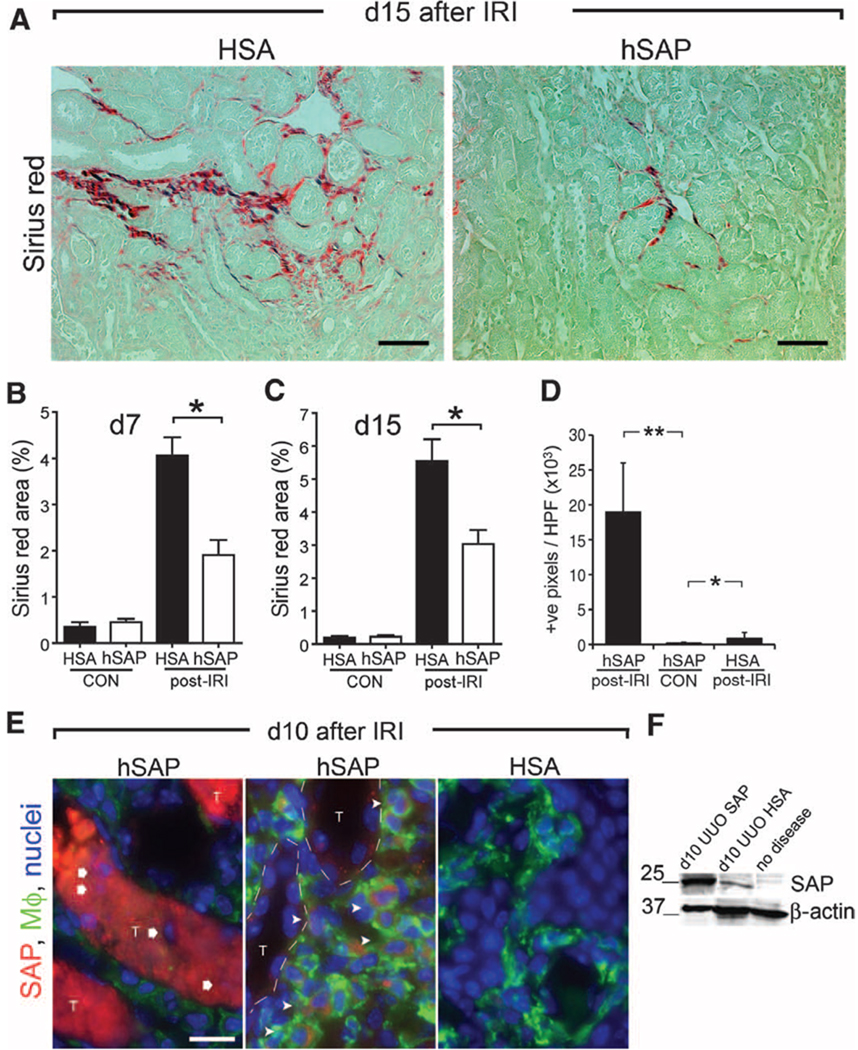
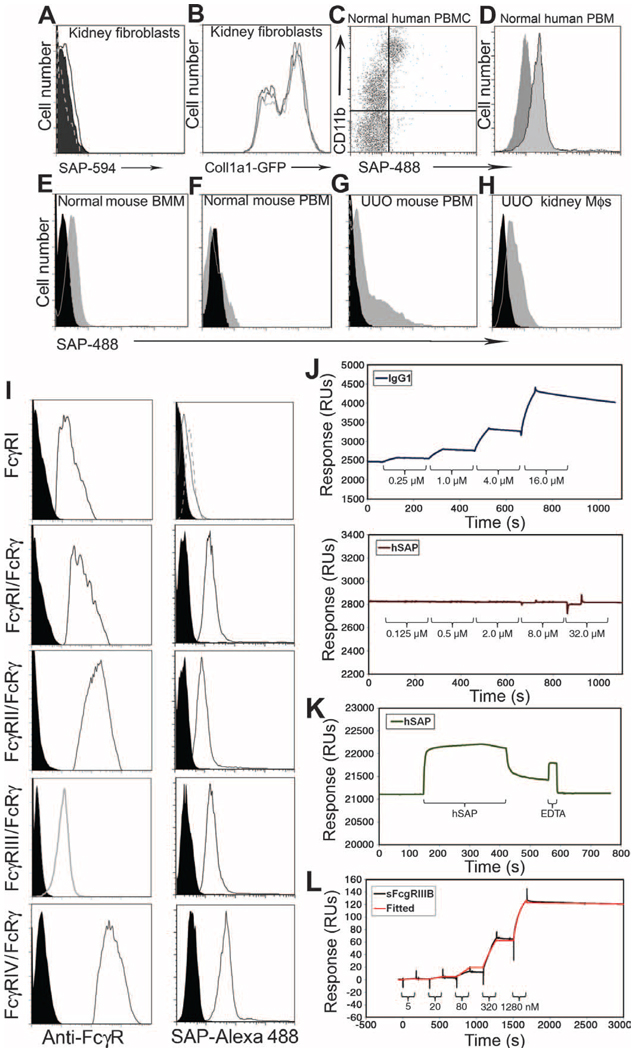
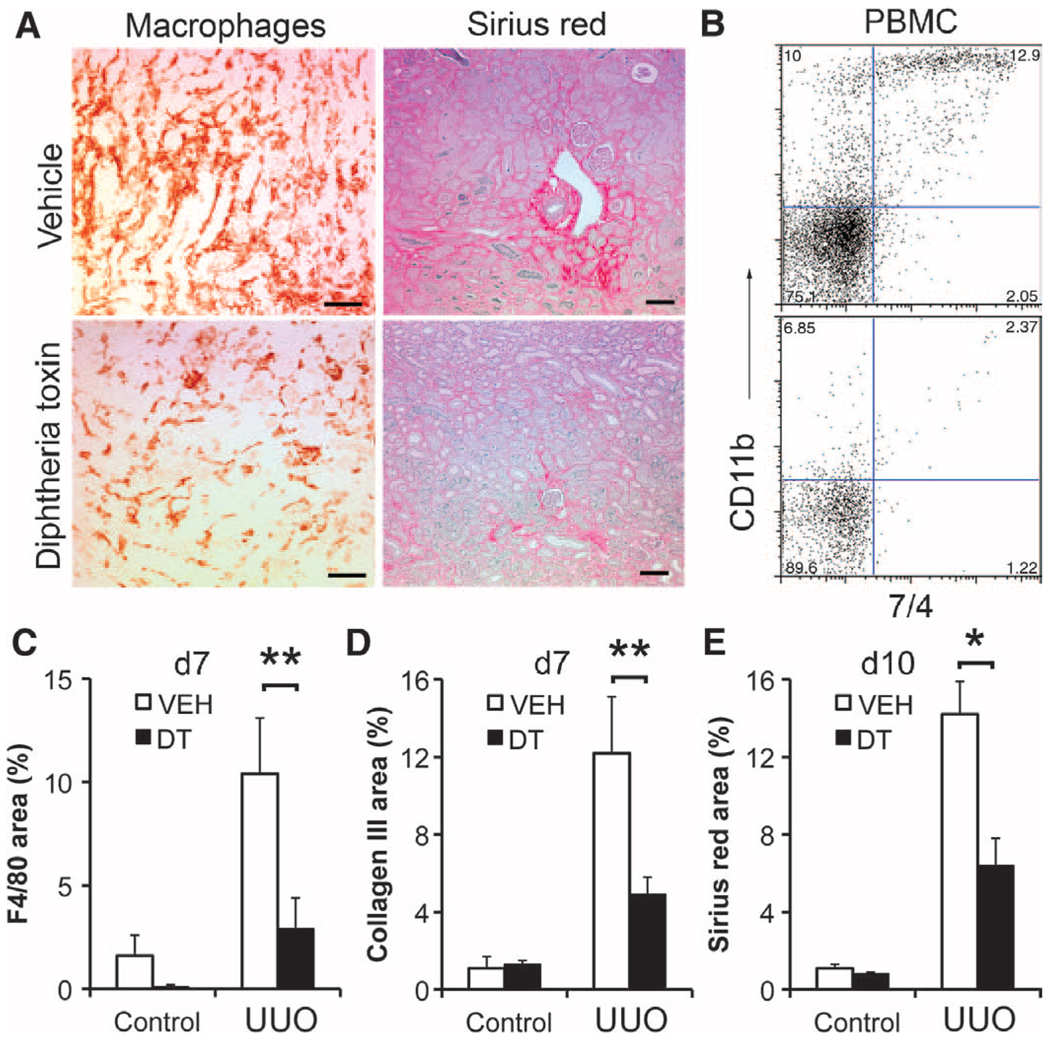
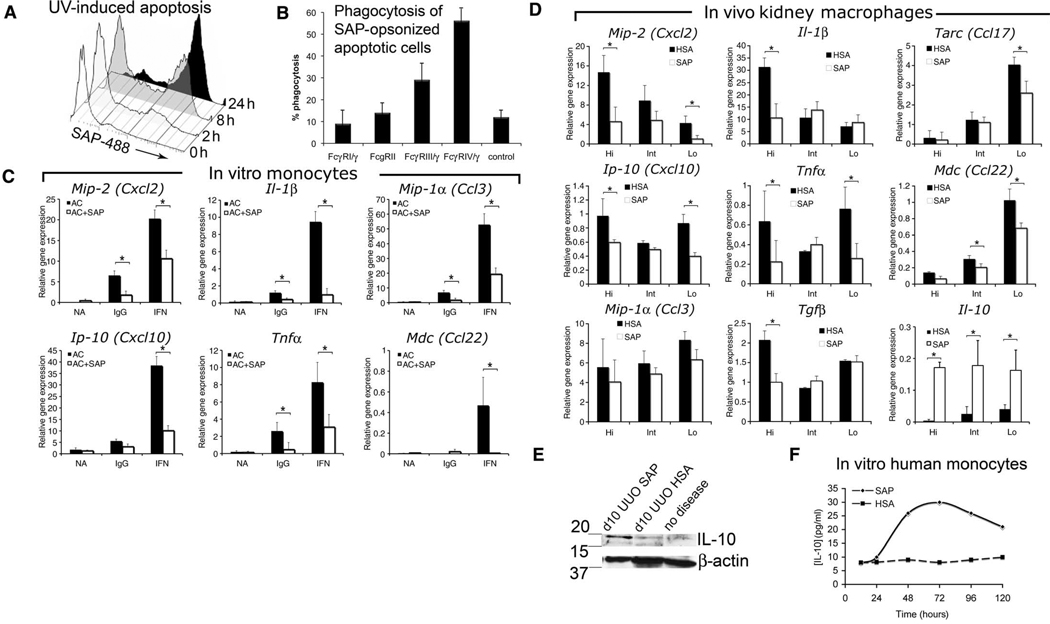
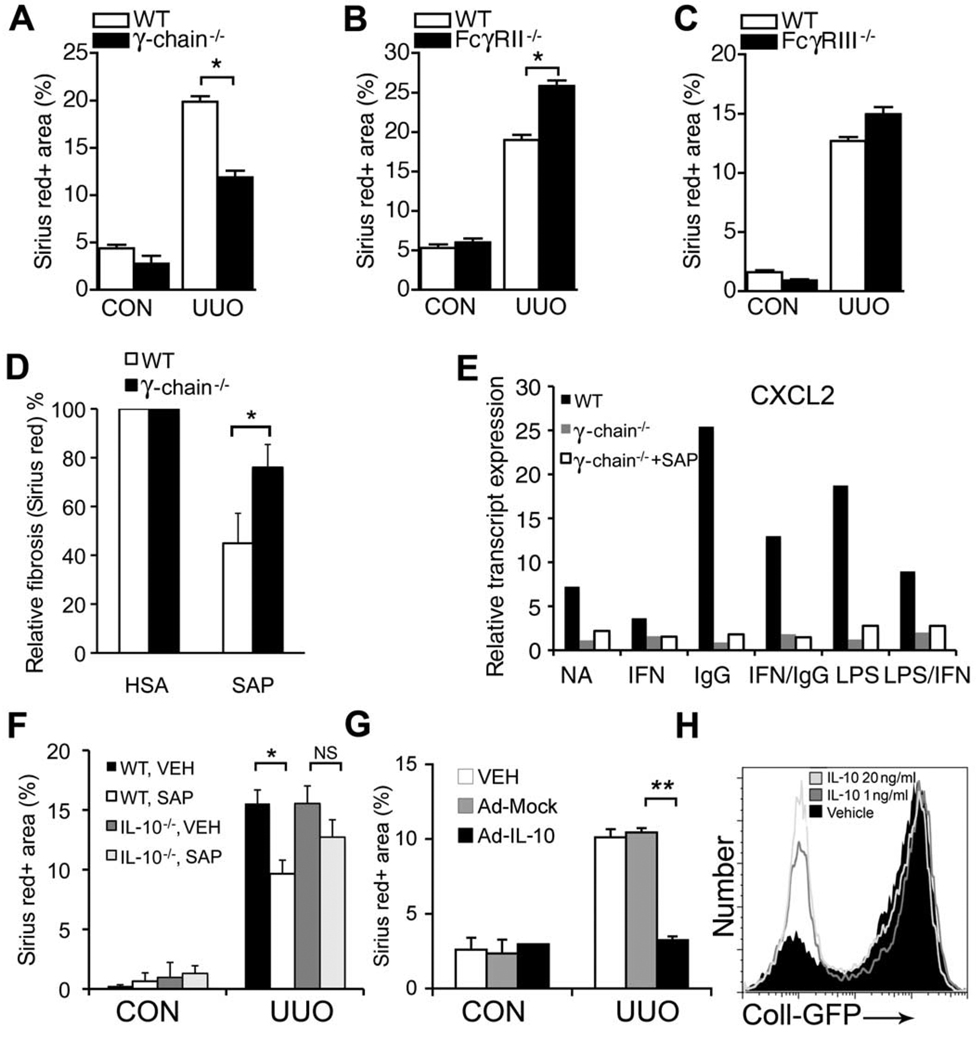
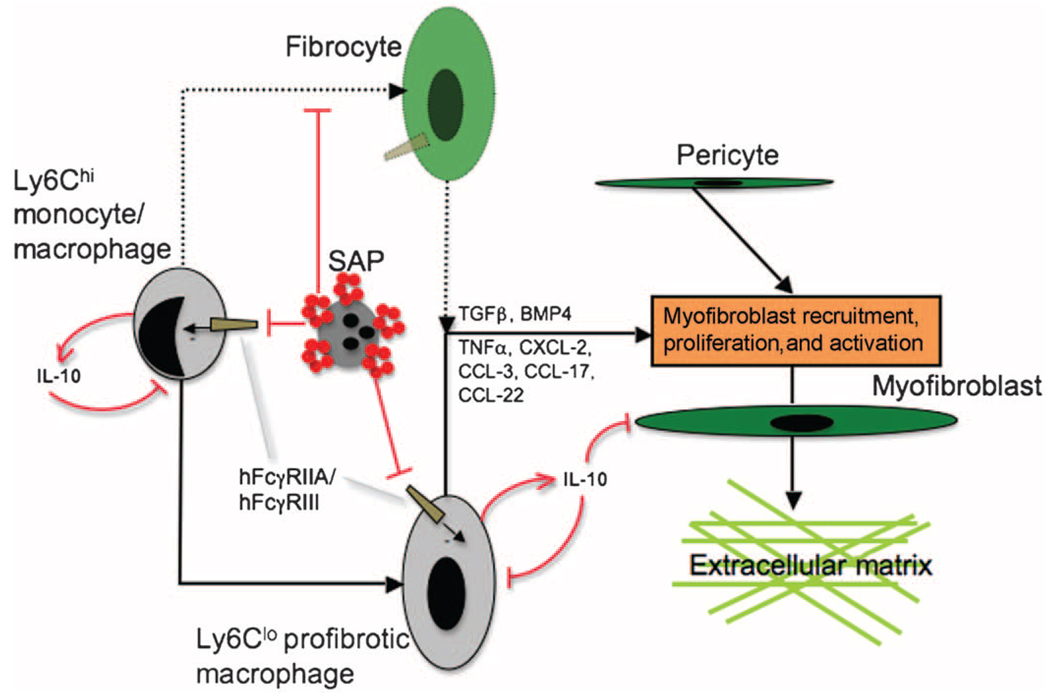
New therapies that target chronic inflammation with fibrosis are urgently required. Increasing evidence points to innate activation of inflammatory cells in driving chronic organ fibrosis. Serum amyloid P is a naturally circulating soluble pattern recognition receptor, a member of the family of pentraxin proteins. It links danger-associated molecular pattern recognition to Fc gamma receptor-mediated phagocytosis. Here we show that fibrosis progression in the mouse kidney is significantly inhibited by therapeutic administration of human serum amyloid P, regulated by activating Fc gamma receptors, and dependent on inflammatory monocytes and macrophages, but not fibrocytes. Human serum amyloid P-mediated inhibition of mouse kidney fibrosis correlated with specific binding of human serum amyloid P to cell debris and with subsequent suppression of inflammatory monocytes and kidney macrophages in vitro and in vivo, and was dependent on regulated binding to activating Fc gamma receptors and interleukin-10 expression. These studies uncover previously unidentified roles for Fc gamma receptors in sterile inflammation and highlight serum amyloid P as a potential antifibrotic therapy through local generation of interleukin-10.


Figures

Fig. 1
Fig. 1
SAP inhibits kidney fibrosis after unilateral ureteral obstruction. (A) Photomicrograph of Sirius red stain or GFP immunofluorescence of day 14 UUO kidneys in Coll1a1-GFP mice treated with HSA or hSAP. Scale bar, 50 µm. (B and C) Morphometric quantification of Sirius red–stained area on (B) day 7 (d7) after UUO or (C) d14 after UUO in kidneys of mice treated with HSA or hSAP [20 mg/kg every 2 days (q2d), n = 6 per group]. CON, control. (D and E) Morphometric quantification of GFP area on (D) d7 after UUO or (E) d14 after UUO in kidneys of Coll-GFP mice treated with HSA or hSAP (n = 6 per group). (F) Graph showing effect of different doses and frequencies of hSAP on Trichrome-stained fibrosis. qd, every day. (G) Immunofluorescence of αSMA-positive (a myofibroblast marker) area in kidneys of Coll-GFP mice on d7 after UUO treated with HSA or hSAP (left panel), and percent of αSMA-positive cells that were Coll1a1-GFP–positive in kidneys treated with SAP or HSA (right panel). Note: hSAP inhibits Coll1a1 gene transcription in kidney myofibroblasts. Marker, 50 µm. (H) Morphometric quantification of F4/80 positive (a macrophage marker) area on d7 after UUO in kidneys of mice treated with HSA or hSAP (n = 6 per group). *P < 0.05, **P < 0.01.
Fig. 2
Fig. 2
SAP inhibits fibrosis after IRI and is selectively deposited in the injured kidney. (A) Sirius red stain of d15 post-IRI kidneys in C57BL6 mice treated with HSA or hSAP (20 mg/kg q2d) (marker, 100 µm). (B and C) Morphometric quantification of Sirius red area in (B) d7 post-IRI kidneys or (C) d15 post-IRI of mice treated with HSA or hSAP. (D) Morphometric quantification of SAP deposition detected by immunofluorescence in d7 post-IRI kidney treated with hSAP or HSA compared with a control, nondiseased kidney. (E) Immunofluorescence images (left panel) of SAP (green) detected in post-IRI kidney after alternate-day intraperitoneal injections of hSAP or HSA. Note that SAP is detected in intratubular cellular debris (left) where nuclear debris can be seen (arrows), but is also seen in interstitial macrophages (F4/80, green) (center) predominantly in endosomes and phagosomes (arrowheads) (F) Western blot of whole-kidney proteins detecting SAP in kidneys d10 after UUO and normal kidney. n = 6 per group. Marker, 50 µm. *P < 0.05, **P < 0.01.
Fig. 3
Fig. 3
SAP binds to the surface of monocyte lineage cells and FcγRs. (A) Histogram plot of binding of SAP-594 compared with that of HSA-594 to primary cultured mouse kidney interstitial fibroblasts purified from Coll-GFP mice. (B) Histogram plot of Coll-GFP fluorescence intensity in primary kidney fibroblasts from Coll-GFP mice cultured for 24 hours with HSA (50 µg/ml; black), hSAP (25 µg/ml; gray), or hSAP (50 µg/ml; light gray). (C) Plot of SAP-488 binding to human PBMCs separated by CD11b. SAP-488 binds selectively to CD11b high leukocytes (monocytes) (high FSC, low SSC) and does not bind to other leukocytes. (D) Histogram showing binding of HSA-488 (dark gray) and SAP-488 (light gray) to human monocytes. (E to H) Histograms showing HSA-488 (black) or SAP-488 (white) binding to (E) purified, mature mouse BMMs, (F) mouse PBM from healthy mice, (G) PBM from mice d7 after UUO, (H) purified kidney macrophages from mice d7 after UUO compared. (I) Histogram plots of 3T3 mouse fibroblast cell lines expressing individual FcγRs with or without the co-receptor FcRγ-chain. Cell surface FcγR expression (white) is shown for individual cell lines (left columns) compared with isotype control (black). Binding of SAP-488 (white) compared with HSA-488 (black) is shown for individual cells lines (right columns). 7-AAD-positive cells are excluded from these binding studies. (J to L) Biochemical characterization of hSAP binding to hFcγRs with Biacore surface plasmon resonance technology. (J) Sensorgrams of human IgG1 (upper panel) binding to hFcγRI (recombinant ectodomain) when the receptor is immobilized on a Biacore CM5 dextran chip, but hSAP (lower panel) was unable to bind to hFcγRI in this orientation. (K) Sensorgram of Ca2+-dependent binding of hSAP to CM5 dextran followed by dissociation in the presence of Ca2+ chelation (10 mM EDTA). (L) Sensorgram of single-cycle kinetic analysis of hFcγRIIIB binding to chip-bound hSAP oriented through Ca2+-dependent binding to the CM5 dextran. Five different receptor concentrations injected in order of increasing concentration were used to obtain data for affinity calculation. Association time was 180 s and the final long dissociation was 7200 s for hFcγRIIIB (attenuated for presentation). Both raw data (black) and data fitted for 1:1 binding (red) are shown on the same sensorgram and represent data after background subtraction. Off-rate is very slow and drives the high affinity of interaction we observed. Results are representative of three independent experiments for each FcγR.
Fig. 4
Fig. 4
Conditional macrophage ablation inhibits kidney fibrosis in ureteral obstruction. (A) Photomicrographs of F4/80 immunostaining for macrophages or Sirius red staining for fibrosis in CD11b-DTR kidneys treated with DT or vehicle to ablate macrophages on d10 after UUO. (B) FACS plots of PBMCs from the same mice labeled with antibodies against CD11b and 7/4 to label monocytes, showing that DT also ablated circulating monocytes. (C to E) Morphometric quantification of F4/80 immunostain (C), collagen III immunostain (D) or Sirius red stain in kidneys 10 days after UUO in vehicle (VEH)-treated or DT-treated CD11b-DTR mice. *P < 0.05, **P < 0.01.
Fig. 5
Fig. 5
hSAP inhibits activation of mouse monocytes and kidney macrophages in vivo and ex vivo by triggering FcγR-dependent uptake of hSAP-opsonized apoptotic cells. (A) Histogram plots showing a time course (hours) of SAP-488 binding to Jurkat T lymphocytes after UV irradiation to induce apoptosis. (B) Representative plot of percentage phagocytosis of hSAP-opsonized apoptotic thymocytes by 3T3-FcγR/FcRγ-chain cell lines after a 4-hour co-incubation. (C) Relative transcript expression, assessed by bDNA amplification (normalized to housekeeping gene Hprt1), by purified mouse BMMs incubated with apoptotic cells (AC), unopsonized (black) or opsonized with hSAP (white), and coactivated with either no stimulus, immobilized IgG, or IFN-γ. (D) Relative transcript expression, assessed by bDNA amplification (normalized to housekeeping gene HPRT1) by three subpopulations of purified kidney macrophages 7 days after UUO, distinguished by the markers Ly6Chi, Ly6Cint, and Ly6Clo, from mice treated with HSA (black) or hSAP (white) by intraperitoneal injections for 7 days. In addition, relative Il-10 transcript expression assessed by Q-PCR (normalized to housekeeping gene GAPDH) is markedly increased in all kidney macrophage populations by hSAP treatment. (E) Western blot of whole-kidney lysates showing IL-10 (18 kD) in d10 UUO kidneys of mice treated with hSAP but only weakly detected in mice treated with HSA. (F) Human monocytes incubated with SAP (5 µg/ml) triggers release of IL-10 protein in supernatants (n = ≥ 3 per group, *P < 0.05).
Fig. 6
Fig. 6
hSAP-inhibited kidney fibrosis is dependent on FcγR and IL-10 expression. (A to C) Morphometric quantification of Sirius red–stained kidney fibrosis 10 days after UUO in age-and strain-matched wild-type (WT) mice compared with (A) FcRγ-chain−/− mice (lacking FcγRI, III, and IV), (B) FcγRII−/− mice, and (C) FcγRIII−/− mice. (D) Morphometric quantification of Sirius red fibrosis. hSAP treatment of FcRγ-chain−/− mice fibrosis results in a significantly smaller reduction in fibrosis on d10 after UUO compared with strain-matched wild-type mice treated with hSAP. (E) CXCL2 relative gene transcription 24 hours after activation with inflammatory cytokines (IFN-γ, iIgG, LPS, or combinations) by wild-type monocytes, FcRγ-chain−/− monocytes or FcRγ-chain−/− monocyte coactivated with hSAP (25 µg/ml). (F) Morphometric quantification of Sirius red–stained kidney fibrosis d10 after UUO in strain-matched wild-type and IL-10−/− mice, treated with either HSA or hSAP. (G) Morphometric quantification of Sirius red–stained kidney fibrosis 10 days after UUO in C57BL6 mice treated systemically with Ad-IL-10, Ad-Mock, or no virus. (H) Histogram plots of cultured Coll-GFP kidney fibroblasts incubated with IL-10 for 8 hours assessed by flow cytometry show decreased Coll1a1 gene transcription. (n = 6 per group; *P < 0.05, **P < 0.01).
Fig. 7
Fig. 7
The antifibrotic mechanism of action of SAP. Apoptotic cells or debris are opsonized by SAP, which in turn renders SAP a high-affinity ligand for hFcγRIIA or hFcγRIII. Both Ly6Chi and Ly6Clo inflammatory macrophages bind SAP-opsonized debris, which triggers IL-10 release, inhibiting macrophage profibrotic function (through recruitment and activation of pericytes/myofibroblasts) and directly inhibiting myofibroblast production of collagen 1a1. Although SAP inhibits fibrocyte appearance, fibrocytes play no role in kidney fibrosis.

Similar articles

Cited by

References

    1. Sansonetti PJ. The innate signaling of dangers and the dangers of innate signaling. Nat. Immunol. 2006;7:1237–1242. - PubMed
    1. Eddy AA. Progression in chronic kidney disease. Adv. Chronic Kidney Dis. 2005;12:353–365. - PubMed
    1. Lupher ML, Jr, Gallatin WM. Regulation of fibrosis by the immune system. Adv. Immunol. 2006;89:245–288. - PubMed
    1. Duffield JS. The inflammatory macrophage: A story of Jekyll and Hyde. Clin. Sci. (Lond.) 2003;104:27–38. - PubMed
    1. Gordon S. Alternative activation of macrophages. Nat. Rev. Immunol. 2003;3:23–35. - PubMed

LinkOut - more resources