. 2009 Nov 25;1(8):8ra19.
doi: 10.1126/scitranslmed.3000359.

In situ regulation of DC subsets and T cells mediates tumor regression in mice

Affiliations

In situ regulation of DC subsets and T cells mediates tumor regression in mice

Omar A Ali et al. Sci Transl Med. .

Abstract

Vaccines are largely ineffective for patients with established cancer, as advanced disease requires potent and sustained activation of CD8(+) cytotoxic T lymphocytes (CTLs) to kill tumor cells and clear the disease. Recent studies have found that subsets of dendritic cells (DCs) specialize in antigen cross-presentation and in the production of cytokines, which regulate both CTLs and T regulatory (Treg) cells that shut down effector T cell responses. Here, we addressed the hypothesis that coordinated regulation of a DC network, and plasmacytoid DCs (pDCs) and CD8(+) DCs in particular, could enhance host immunity in mice. We used functionalized biomaterials incorporating various combinations of an inflammatory cytokine, immune danger signal, and tumor lysates to control the activation and localization of host DC populations in situ. The numbers of pDCs and CD8(+) DCs, and the endogenous production of interleukin-12, all correlated strongly with the magnitude of protective antitumor immunity and the generation of potent CD8(+) CTLs. Vaccination by this method maintained local and systemic CTL responses for extended periods while inhibiting FoxP3 Treg activity during antigen clearance, resulting in complete regression of distant and established melanoma tumors. The efficacy of this vaccine as a monotherapy against large invasive tumors may be a result of the local activity of pDCs and CD8(+) DCs induced by persistent danger and antigen signaling at the vaccine site. These results indicate that a critical pattern of DC subsets correlates with the evolution of therapeutic antitumor responses and provide a template for future vaccine design.


Conflict of interest statement

Competing Interests: O.A., G.D., and D.J.M. have filed an application for a patent on the technology described in this manuscript. O.A. and D.E. are currently working for InCytu, Inc. to commercialize the technology.

Figures

Fig. 1
Fig. 1. GM-CSF delivery from PLG matrices promotes CD11b+ DC recruitment and activation
(A) H&E staining of sectioned PLG scaffolds explanted from subcutaneous pockets in the backs of C57BL/6J mice after 14 days: Blank scaffolds (BLANK), and GM-CSF (3000 ng) loaded scaffolds (GM-CSF). (B) The number of CD11c(+) DCs isolated from PLG scaffolds at day 14 after implantation in response to doses of 0, 1000, 3000 and 7000 ng of GM-CSF. (C) FACS plots of cells isolated from explanted scaffolds and stained for CD11c and CD11b. Cells were isolated from PLG matrices incorporating 3,000ng of GM-CSF at day 10 post-implantation. Numbers in FACS plots indicate the percentage of the cell population positive for CD11c and CD11b or for both markers. (D) The number of CD11c(+)CD86(+), CD11c(+)CCR7(+), and Cd11c(+)MHCII(+) DCs isolated from PLG scaffolds at day 14 after implantation in response to doses of 0, 400, 3000 and 7000 ng of GM-CSF. Values in B and D represent mean and standard deviation (n=4 or 5). * P<0.05 ** P<0.01 as compared to blank matrices unless otherwise noted.
Fig. 2
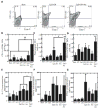
Fig. 2. CpG-ODN and GM-CSF delivery from PLG matrices promotes plasmacytoid DC generation and the production of anti-tumor cytokines
(A) FACS plots of cells isolated from explanted scaffolds and stained for the plasmacytoid DC markers, CD11c and PDCA-1. Cells were isolated from PLG matrices incorporating 0, 1, 10, and 100 μg of CpG-ODN at day 10 post-implantation. Numbers in FACS plots indicate the percentage of the cell population positive for CD11c only or for both markers. The number of (B) plasmacytoid DCs, and (C) CD11c(+)CD11b(+) cDCs at day 10 post-implantation in blank scaffolds (Blank) or in response to doses of 100 μg (100) of CpG-ODN or 3000ng GM-CSF alone (GM) or GM-CSF in combination with 1 (1+GM), 10 (10+GM), or 100 μg (100+GM) of CpG-ODN. The in vivo concentrations of (D) IFN-α, and (E) IFN-γ at Day 10 post implantation at the implant site of blank PLG matrices (Blank), or matrices loaded with 3000ng GM-CSF alone (GM) or 10μg or 100μg (100) of CpG-ODN alone or GM-CSF in combination with 10 (10+GM), or100 μg (100+GM) of CpG-ODN. Values in B-E represent mean and standard deviation (n=4 or 5). * P<0.05 ** P<0.01 as compared to blank matrices unless otherwise noted.
Fig. 3
Fig. 3. Tumor lysate, CpG-ODN, and GM-CSF co-delivery from PLG matrices stimulates CD8+ DC generation and IL-12 production
(A) FACS density plots of CD11c and CD8 staining of cells infiltrating Blank PLG matrices (blank) or matrices loaded with 3000ng GM-CSF and 100μg CpG-ODN without (CpG+GM) or with tumor lysates (CpG+GM+Ant) at day 10. Numbers in FACS plots indicate the percentage of the cell population positive for CD11c and CD8 or for both markers. (B-D)The number of (B) CD11c(+)CD8(+) cDCs, (C) plasmacytoid DCs, and (D) CD11c(+)CD11b(+) cDCs at day 10 after implantation in blank matrices (Blank) and in response to 3000ng GM-CSF(GM) or 100 μg CpG-ODN (CpG) alone or in combination (CpG+GM) or co-presented with tumor lysates (GM+Ant, CpG+Ant and CpG+GM+Ant). (E-G) The in vivo concentration of (E) IL-12, (F) IFN-α, and (G) IFN-γ at day 10 after implantation in blank matrices (Blank) and in response to doses of 3000ng GM-CSF (GM) or 100 μg CpG-ODN (CpG) alone or in combination (CpG+GM) or co-presented with tumor lysates (GM+Ant, CpG+Ant and CpG+GM+Ant). Values in B-G represent mean and SD (n=4 or 5). * P<0.05 ** P<0.01, as compared to blank matrices, unless otherwise noted.
Fig. 4
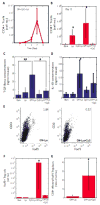
Fig. 4. Tumor lysate, CpG-ODN, and GM-CSF co-delivery in PLG matrices stimulates potent local and systemic CD8+ cytoxic T cells
(A) FACS plots of cells isolated from explanted matrices and stained for the cytotoxic T cell markers, CD3 and CD8a. Cells were isolated from PLG matrices with3000ng GM-CSF, 100 μg CpG-ODN and tumor lysates at days 1, 5, 12 and 21 after implantation. Numbers in FACS plots indicate the percentage of the cell population that was either single positive for CD3 (upper left quadrant of each plot) or CD8 (lower right), or double positive for both markers (upper right). (B) The total number of CD3(+)CD8(+) cytotoxic T cells isolated from PLG matrices loaded with GM-CSF, CpG-ODN and tumor lysates as a function of time after implantation. (C) The number of CD8 T cells at day 12 after implantation in blank scaffolds (Blank) or in response to lysate alone (Lys) or in combination with CpG-ODN (CpG+Lys) or GM-CSF (GM+Lys) or both factors (GM+Lys+CpG). (D) FACS plots of splenocytes of naïve mice and mice vaccinated with PLG vaccines containing 3000ng GM-CSF, 100μgCpG-ODN, and tumor lysates at day 16 post-implantation. Cells were stained with anti-CD8-PE Ab, and Kb/TRP2 pentamers. The gates represent the TRP2-specific, CD8(+) T cells and numbers provide the percentage of gated cells. (E) The total number of TRP2-specific, CD8(+) T cells in the spleens of mice vaccinated with PLG matrices loaded with GM-CSF, CpG-ODN and tumor lysates as a function of time after implantation. Values in B, C and E represent mean and standard deviation (n=4 or 5). * P<0.05 as compared to all other experimental conditions.
Fig. 5
Fig. 5. Tumor protection stimulated by engineered PLG matrices is correlated with DC subsets and IL-12 production
Survival times of mice vaccinated with PLG vaccines 14 days prior to B16-F10 melanoma tumor challenge (105 cells). (A) A comparison of survival times in mice treated with blank PLG matrices or with PLG matrices loaded with tumor lysates and 1, 10, 50 or 100μg of CpG-ODN. (B) A comparison of survival times in mice vaccinated with PLG matrices loaded with tumor lysates, 3000ng GM-CSF and either 1, 10, 50 or 100μg of CpG-ODN. (C) The fraction of the total CD11c(+) DC population consisting of CD11b(+) cDCs (white bar), PDCA-1(+) pDCs (black bar), and CD8(+) cDCs (striped bar) generated at the PLG vaccine site at day 10. Vaccines were loaded with either 3000ng GM-CSF, or 100μg of CpG-ODN alone or in combination. Survival percentages recorded at day 100 after tumor challenge. Plots of the numbers of (D) CD11c(+)CD8(+) cDCs (E) CD11c(+)PDCA-1(+) pDCs, and (F) CD11c(+)CD11b(+) cDCs, and (G) the concentration of IL-12 at the PLG vaccine site at day 10 versus the percent of animals surviving B16-F10 melanoma tumor challenge at Day 100 (survival data taken from experimental conditions in A and B). Values in D-G represent mean and SD (n=4 or 5). r values in D-F represent the linear correlation coefficient between DC numbers or IL-12 concentration and survival percentage.
Fig. 6
Fig. 6. Engineered PLG matrices attenuate FoxP3+ Tregs and immunosuppressive cytokines
(A) The total number of CD3(+)CD4(+) T cells isolated from PLG matrices loaded with GM-CSF, CpG-ODN and tumor lysates as a function of time after implantation. (B) The number of CD4 T cells at day 12 after implantation in blank scaffolds (Blank) or in response to lysate alone (Lys) or in combination with CpG-ODN (CpG+Lys) or GM-CSF (GM+Lys) or both factors (GM+Lys+CpG). The in vivo concentrations of (C) TGF-β and (D) IL-10 at Day 12 post implantation at the implant site of blank scaffolds (Blank) or scaffolds presenting lysate alone (Lys) or in combination with CpG-ODN (CpG+Lys) or GM-CSF (GM+Lys) or both factors (GM+Lys+CpG). (E) FACS plots of cells isolated from explanted scaffolds and stained for the T regulatory cell markers, CD3 and FoxP3. Cells were isolated from PLG matrices incorporating GM-CSF and lysates without (GM+Lys) or with GM-CSF, lysates and CpG-ODN (GM+Lys+CpG) at day 12 after implantation. Numbers in FACS plots indicate the percentage of the cell population positive for both markers. (F) The number of FoxP3(+) Tregs at day 12 post-implantation in blank scaffolds (Blank) or in response to lysate alone (Lys) or in combination with CpG-ODN (CpG+Lys) or GM-CSF (GM+Lys) or both factors (GM+Lys+CpG). (G) The ratio of CD8a T cells versus FoxP3(+) Tregs residing within PLG scaffolds loaded with GM-CSF and Lysates (GM+Lys) alone or in combination with CpG-ODN (GM+Lys+CpG) at day 12 post-implantation. Values in A-D, F and G represent mean and SD (n=4 or 5). * P<0.05 ** P<0.01 as compared to all other experimental conditions unless otherwise noted.
Fig. 7
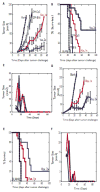
Fig. 7. Engineered PLG matrices stimulate the regression of established melanomas
A comparison of the (A) tumor growth and (B) survival of mice bearing established melanoma tumors (inoculated with 5×10⁵ B16-F10 cells and allowed to develop for 9 days) and treated with either blank PLG matrices (Blank), or matrices loaded with 3000ng GM-CSF and 100ug CpG-ODN (GM+CpG). Mice were also treated once (Vax, 1x; at day 9) or twice (Vax, 2x; at days 9 and 19) with PLG matrices incorporating GM-CSF, CpG-ODN and tumor lysates (Vax). Mice were also vaccinated with 5×10⁵ irradiated, GM-CSF transduced B16-F10 cells. (C) The individual tumor growth curves for each mouse surviving tumor challenge (5×10⁵ cells) after a two-time treatment with PLG vaccines at days 9 and 19. A comparison of the (D) tumor growth and (E) survival of mice bearing established melanoma tumors (inoculated with 5×10⁵ B16-F10 cells and allowed to develop for 13 days) and treated with either blank PLG matrices (Blank), or once with PLG vaccines (Vax, 1x; at day 13) or twice (Vax, 2x; at days 13 and 23). (F) The individual tumor growth curves for each mouse surviving tumor challenge (5×10⁵ cells) after a two-time treatment with PLG vaccines at days 13 and 23. Values in A & D (A-F; n=15 per condition) represent mean and standard error of the mean.

Similar articles

Cited by

References

    1. Rosenberg SA, Yang JC, Restifo NP. Cancer immunotherapy: moving beyond current vaccines. Nat Med. 2004;10:909–915. - PMC - PubMed
    1. Klebanoff CA, Gattinoni L, Restifo NP. CD8+ T-cell memory in tumor immunology and immunotherapy. Immunol Rev. 2006;211:214–224. - PMC - PubMed
    1. Banchereau J, Steinman RM. Taking dendritic cells into medicine. Nature. 2007;49:419–426. - PubMed
    1. Gilboa E. Dendritic cell based vaccines. J Clin Invest. 2007;117:1195–1203. - PMC - PubMed
    1. Schuler G, Schuler-Thurner B, Steinman RM. The use of dendritic cells in cancer immunotherapy. Curr Opin Immunol. 2003;15:138–147. - PubMed

Publication types

MeSH terms