. 2010 Jun;30(11):2811-22.
doi: 10.1128/MCB.01016-09. Epub 2010 Apr 5.

EKLF directly activates the p21WAF1/CIP1 gene by proximal promoter and novel intronic regulatory regions during erythroid differentiation

Affiliations

EKLF directly activates the p21WAF1/CIP1 gene by proximal promoter and novel intronic regulatory regions during erythroid differentiation

Miroslawa Siatecka et al. Mol Cell Biol. 2010 Jun.

Abstract

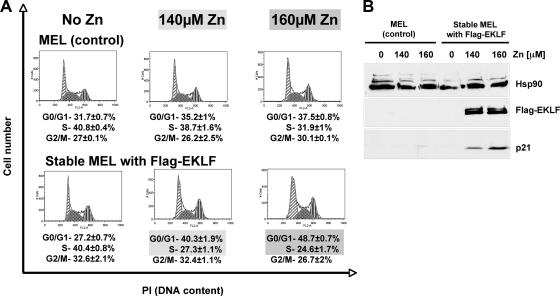
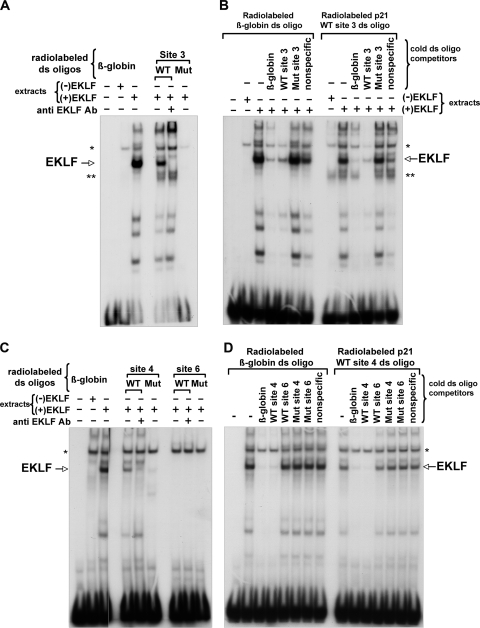
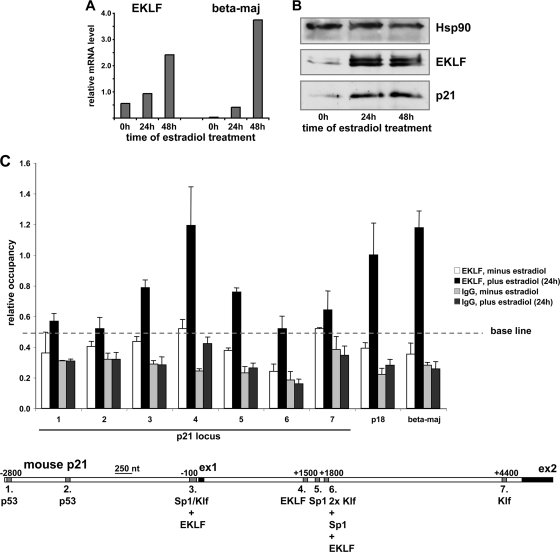
The switch from proliferation to differentiation during the terminal stages of erythropoiesis is a tightly controlled process that relies in part on transcription factor-mediated activation of cell cycle components. EKLF is a key transcription factor that is necessary for the initial establishment of the red cell phenotype. Here, we find that EKLF also plays a role during the subsequent differentiation process, as it induces p21(WAF1/CIP1) expression independent of p53 to regulate the changes in the cell cycle underlying erythroid maturation. EKLF activates p21 not only by directly binding to an EKLF site within a previously characterized GC-rich region in the p21 proximal promoter but also by occupancy at a novel, phylogenetically conserved region that contains consensus CACCC core motifs located downstream from the p21 TATA box. Our findings demonstrate that EKLF, likely in coordination with other transcription factors, directly contributes to the complex set of events that occur at the final erythroid cell divisions and accentuates terminal differentiation directly by activation of CDK inhibitors such as p21.


Figures

FIG. 1.
FIG. 1.
Enforced expression of EKLF activates the p21 promoter. (A) Stable Flag-EKLF MEL cells were monitored for Flag-EKLF, p21, and ERK protein expression at various times, as indicated after induction with 160 μM ZnCl2 (50). (B) Endogenous p21 mRNA levels (triplicates normalized to GAPDH [glyceraldehyde-3-phosphate dehydrogenase]) in total RNA prepared from stable Flag-EKLF MEL cell samples as shown in panel A were monitored by RT-qPCR. (C) Levels of EKLF, p21, CDK4, p27, E2F2, and c-Myc mRNA expression from total RNA collected from parental MEL or stable MEL cells treated with ZnCl2 for 18 h (coded as indicated) were monitored by quantitative RT-PCR analysis. The mRNA level of parental MEL cells without Zn induction was given an arbitrary value of 1, and all other levels were normalized to that value for comparison. EKLF primers were designed to monitor the sum of endogenous and exogenous mRNA. Expression of GAPDH was used to standardize the particular expression levels. Experiments were performed three times; relative expression values are the average values of triplicates.
FIG. 2.
FIG. 2.
EKLF induces cell cycle arrest. (A) Parental MEL cells and MEL cells stably expressing Flag-WT EKLF were cultured in the presence of ZnCl2 (0, 140, and 160 μM) for 24 h. Cells were fixed, stained, and analyzed by flow cytometry. Cell cycle analysis was conducted by utilizing the Dean/Jett/Fox model (FlowJo software; Tree Star). Numbers indicate the percentages of cells in the different phases of the cell cycle. Data are representative results from four experiments. PI, propidium iodide. (B) Whole-cell lysates from parental and stable MEL cells treated with ZnCl2 for 24 h and used for the analysis shown in panel A were analyzed for EKLF and p21 protein expression. Equal loading was assessed by probing with Hsp90 antibody.
FIG. 3.
FIG. 3.
Phylogeny of the p21 locus. (A) A phylogenetic alignment of seven mammalian cdkn1a (p21WAF1/CIP1) loci (each sequence, 15 kb; total alignment length, about 27,400 nucleotides [nt]) identifies several conserved regulatory regions upstream of the transcription start site and within the first intron. Each sequence is represented as a black line (breaks demarcate gaps in the alignment). Repeats or low-complexity DNA are represented as blue bars, while exons are depicted either as tan bars for untranslated regions (UTR) or as red bars for translated regions. The position of a fourth exon described for the human p21 gene is indicated as Hs exon 1A. The degree of sequence conservation between species is expressed as a score (y axis) per nucleotide position (x axis; global length). Peaks of conservation above 0.6 (red line) within noncoding regions are deemed functionally significant (6). The seven conserved sites discussed in the text are numbered below their location in the alignment, as indicated by arrows. An expansion of selected regions (sites 3, 4, and 6) is shown below (based on panel B). Transcription factor consensus motifs used for putative binding site search are as follows: p53, RRRCWWGYYY (48); Sp1, CCCGCC; KLF, CACCC (60); and EKLF, (N/C)CNCNCCC (15). No conserved WGATAR motifs were found across the entire length of the p21 alignment. (B) Detailed view at nucleotide resolution of the seven regions within the phylogenetic alignment of the cdkn1a (p21WAF1/CIP1) locus that display conserved consensus binding sites of either p53 (highlighted in blue), KLF (bright green), EKLF (turquoise), or Sp1 (pink). The TATA box and predicted transcription start site(s) (highlighted in red) downstream of the GC-rich cluster are indicated as well. The respective transcription factor consensus binding motifs and names are displayed above each conserved site, with capital versus lowercase letters indicating the degree of conservation. Both strands were searched for consensus binding motifs, which are denoted 5′ to 3′ in either case. Site 3 is also alternatively highlighted (3b) to show the consensus EKLF binding sites (turquoise) that are dispersed within the gaps generated by the alignment program. Mm = Mus Musculus = mouse; Hs = Homo sapiens = human; Pt = Pan troglodytes = chimpanzee; Cf = Canis familiaris = dog; Rn = Rattus norvegicus = rat; Bt = Bos taurus = cow; MaM = Macaca mulatta = rhesus (macaque).
FIG. 4.
FIG. 4.
EKLF binds to the p21 promoter and novel intronic CACCC element sites in vitro. Gel shift assays were performed with wild-type or mutant (Mut) radiolabeled double-stranded (ds) oligonucleotides, comprising p21 promoter EKLF binding site 3 (A) and p21 intronic predicted EKLF binding sites 4 or 6 (C), after incubation with the indicated extracts from COS7 cells. A probe containing the β-globin CACCC site (31) was used as a positive binding control; anti-EKLF antibody 4B9 was included, as indicated (63). (B and D) Radiolabeled ds oligonucleotides for the β-globin CACCC site (left) and p21 WT site 3 (B, right) or p21 WT site 4 (D, right) were subjected to binding competition with a 100-fold molar excess of the indicated unlabeled (cold) ds oligonucleotides in the presence of extract from COS7 cells expressing EKLF. Asterisk, nonspecific band; double asterisk, specific band (non-EKLF) only observed with WT site 3.
FIG. 5.
FIG. 5.
EKLF directly binds to the p21 promoter and intron in vivo. (A) EKLF and β-globin (beta-maj) mRNA levels as determined by RT-qPCR were monitored after treatment of G1E-ER-Gata1 cells with estradiol for up to 48 h. (B) EKLF and p21 protein levels were monitored by Western blot analysis in whole-cell lysates prepared from G1E-ER-Gata1 cells after estradiol treatment for up to 48 h. Substantial upregulation of p21 protein levels occurred in G1E-ER-Gata1 cells within 24 h of induced erythroid differentiation (middle). Hsp90 served as a loading control. (C) Chromatin immunoprecipitation analysis of EKLF occupancy at distinct sites within the p21, p18, and β-globin loci in G1E-ER-Gata1 cells was performed with anti-EKLF 7B2 antibody or its IgG isotype control before or after stimulation with estradiol for 24 h, as indicated. Sites 1 to 7 within the p21 locus correspond to the regions harboring the identified, conserved transcription factor DNA binding consensus motifs, as indicated in Fig. 3 and as depicted schematically below for the mouse p21 genomic sequence. Known EKLF binding sites within the p18 locus (54) and the β-globin (beta-maj) promoter (21) were used as positive controls.
FIG. 6.
FIG. 6.
EKLF activates the p21 gene through its interactions with upstream promoter and downstream intronic regions in Drosophila and human cells. EKLF transactivation of the p21 promoter was tested by transient cotransfection into Drosophila S2 cells (A, B) or human K562 cells (C to E) with plasmids containing the luciferase reporter gene under the control of the human p21 promoter (bp −194 to +31 or −33 to +2) that varies in the presence of the EKLF binding motif in site 3 (A, C), the human p21 promoter and the intronic region (bp −949 to +1838) (B, D), or the intronic region alone (bp +842 to +1838) (E), each of which varied as to the presence of sites 4 to 6. An EKLF expression plasmid or empty vector was included as indicated (− or +). A Renilla reporter construct was included as a normalization control for transfection efficiency. An average of triplicate results is shown (arithmetic mean ± standard deviation). The genomic layout of the promoter/intronic region of p21 is depicted at the bottom. RLU, relative light units.
FIG. 7.
FIG. 7.
Knockdown of EKLF leads to decreased p21 expression in G1E-ER-Gata1 cells. (A) G1E-ER-Gata1 cells were transfected with 80 nM of four different anti-EKLF siRNAs or a nontargeting AllStars negative-control siRNA for 24 h and then treated with 0.1 μM β-estradiol for an additional 24 h. Cells were collected, and cell lysates were subjected to Western blot analysis with EKLF and p21 antibodies. Equal loading was assessed with Hsp90 antibody. The data are representative of results from two experiments. (B) Individual protein levels of EKLF, before and after EKLF knockdown, were quantified from three experiments and plotted against the quantified level of p21 protein derived from the same extract. A correlation coefficient of 0.85 with a linear slope of 1.02 was attained between the two sets.
FIG. 8.
FIG. 8.
EKLF contributes to Gata1 activation through its binding site within the hematopoietic enhancer element. (A) Excerpt of the phylogenetic alignment of the Gata1 locus from four mammalian species (Mm = Mus musculus, or mouse; Rn = Rattus norvegicus, or rat; Hs = Homo sapiens, or human; Cf = Canis familiaris, or dog) at nucleotide resolution, as previously displayed by Lohmann and Bieker (26), showing the hematopoietic enhancer (HE) element of the Gata1 locus and a conserved region of Gata1 exon6. A known conserved WGATAR motif that is required for Gata1 expression at the progenitor stage as well as in committed erythroid cells (35, 57) is highlighted in light gray, while newly identified EKLF and KLF consensus sites are highlighted in dark gray. The transcription factor consensus binding motifs and names are displayed above each conserved site, with capital versus lowercase letters indicating the degree of conservation. Both strands were searched for consensus binding motifs, which are denoted 5′ to 3′ in either case. (B) EKLF occupancy at the Gata1 hematopoietic enhancer (HE), as analyzed by chromatin immunoprecipitation in G1E-ER-Gata1 cells treated with or without estradiol for 24 h, analogous to that shown in Fig. 5C. A conserved GC-rich element in Gata1 exon6 (ex6) serves as a negative control, while EKLF occupancy at the β-globin (beta-maj) promoter from Fig. 5C is shown for comparison.

Similar articles

Cited by

References

    1. Bao, S., and R. Cagan. 2005. Preferential adhesion mediated by Hibris and Roughest regulates morphogenesis and patterning in the Drosophila eye. Dev. Cell 8:925-935. - PubMed
    1. Bieker, J. J. 2000. EKLF and the development of the erythroid lineage, p. 71-84. In J. D. Light and K. Ravid (ed.), Transcription factors: normal and malignant development of blood cells. Wiley-Liss, New York, NY.
    1. Bieker, J. J. 1996. Isolation, genomic structure, and expression of human erythroid Kruppel-like factor (EKLF). DNA Cell Biol. 15:347-352. - PubMed
    1. Bottardi, S., J. Ross, N. Pierre-Charles, V. Blank, and E. Milot. 2006. Lineage-specific activators affect beta-globin locus chromatin in multipotent hematopoietic progenitors. EMBO J. 25:3586-3595. - PMC - PubMed
    1. Bouilloux, F., G. Juban, N. Cohet, D. Buet, B. Guyot, W. Vainchenker, F. Louache, and F. Morle. 2008. EKLF restricts megakaryocytic differentiation at the benefit of erythrocytic differentiation. Blood 112:576-584. - PubMed

Publication types

MeSH terms

Substances

LinkOut - more resources