. 2010 Apr 20;107(16):7353-8.
doi: 10.1073/pnas.0910339107. Epub 2010 Apr 5.

Contrasting genetic paths to morphological and physiological evolution

Affiliations

Contrasting genetic paths to morphological and physiological evolution

Ben-Yang Liao et al. Proc Natl Acad Sci U S A. .

Abstract

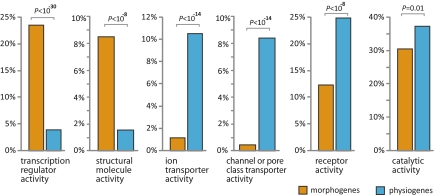
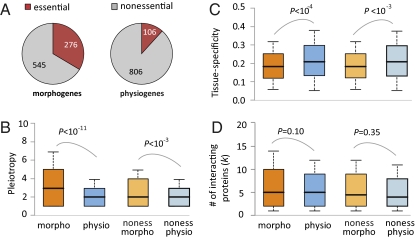
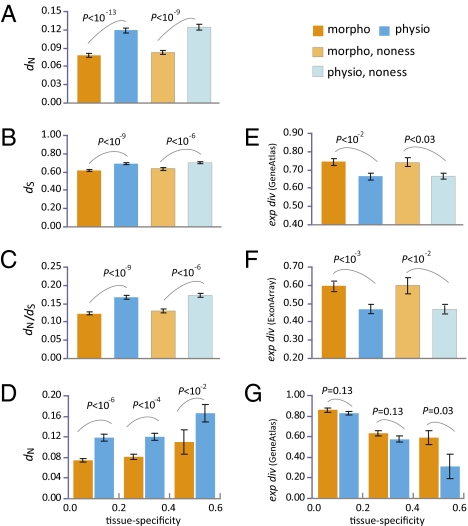
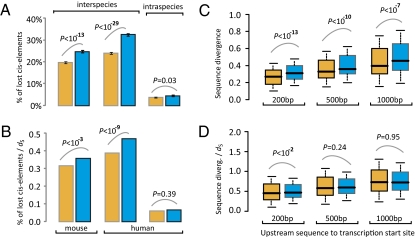
The relative importance of protein function change and gene expression change in phenotypic evolution is a contentious, yet central topic in evolutionary biology. Analyzing 5,199 mouse genes with recorded mutant phenotypes, we find that genes exclusively affecting morphological traits when mutated (dubbed "morphogenes") are grossly enriched with transcriptional regulators, whereas those exclusively affecting physiological traits (dubbed "physiogenes") are enriched with channels, transporters, receptors, and enzymes. Compared to physiogenes, morphogenes are more likely to be essential and pleiotropic and less likely to be tissue specific. Morphogenes evolve faster in expression profile, but slower in protein sequence and gene gain/loss than physiogenes. Thus, morphological and physiological changes have a differential molecular basis; separating them helps discern the genetic mechanisms of phenotypic evolution.


Conflict of interest statement

The authors declare no conflict of interest.

Figures

Fig. 1.
Fig. 1.
Major differences in molecular function between mouse morphogenes and physiogenes. Shown here are the fractions of morphogenes and physiogenes belonging to selected large functional categories at Gene Ontology (GO) level 2 and level 3. P values have been corrected for multiple testing in FatiGO (http://www.fatigo.org/). The complete list of significant GO differences between morphogenes and physiogenes is in Table S3.
Fig. 2.
Fig. 2.
Mouse morphogenes and physiogenes are significantly different in (A) the proportion of essential genes, (B) pleiotropy, and (C) tissue specificity in expression, but not in (D) the number of protein–protein interaction partners. The numbers in A indicate the number of genes. For BD, the values of upper quartile, median, and lower quartile are indicated in each box, whereas the bars outside the box indicate semiquartile ranges. P values are from a χ2 test for A (P < E-27) and from a Mann–Whitney U test for B–D. Morpho, morphogenes; noness, nonessential; physio, physiogenes.
Fig. 3.
Fig. 3.
Evolutionary divergences between mouse and human orthologous genes measured by (A) nonsynonymous distance (dN), (B) synonymous distance (dS), (C) dN/dS, (D) dN controlled for tissue specificity, (E) expression-profile distance from GeneAtlas data, (F) expression-profile distance from ExonArrays data, and (G) expression-profile distance from GeneAtlas data controlled for tissue specificity. Error bars show one standard error of the mean. P values are from a Mann–Whitney U test. Morpho, morphogenes; noness, nonessential; physio, physiogenes.
Fig. 4.
Fig. 4.
Evolutionary divergences between mouse and human orthologous genes in cis-regulatory elements and noncoding regions upstream of the transcription start site. (A) Rates of loss of cis-elements within and between species. The interspecies comparison shows the fractions of mouse (or human) cis-elements that are lost in human (or mouse). The intraspecies comparison shows the fraction of human cis-elements that harbor SNPs among human individuals. (B) Rates of loss of cis-elements within and between species, controlled for local mutation rates by dS. (C) Sequence divergence (1 − identity) in upstream noncoding regions and (D) sequence divergence in upstream noncoding regions, controlled for local mutation rates by dS. The values of upper quartile, median, and lower quartile are indicated in each box, whereas the bars outside the box indicate semiquartile ranges. P values are from a Mann–Whitney U test.

References

    1. King MC, Wilson AC. Evolution at two levels in humans and chimpanzees. Science. 1975;188:107–116. - PubMed
    1. Chimpanzee Sequencing and Analysis Consortium. Initial sequence of the chimpanzee genome and comparison with the human genome. Nature. 2005;437:69–87. - PubMed
    1. Glazko G, Veeramachaneni V, Nei M, Makałowski W. Eighty percent of proteins are different between humans and chimpanzees. Gene. 2005;346:215–219. - PubMed
    1. Carroll SB. Evo-devo and an expanding evolutionary synthesis: A genetic theory of morphological evolution. Cell. 2008;134:25–36. - PubMed
    1. Wray GA. The evolutionary significance of cis-regulatory mutations. Nat Rev Genet. 2007;8:206–216. - PubMed

Publication types