Epigenetic stability increases extensively during Drosophila follicle stem cell differentiation
- PMID: 20368445
- PMCID: PMC2867689
- DOI: 10.1073/pnas.1003180107
Epigenetic stability increases extensively during Drosophila follicle stem cell differentiation
Abstract
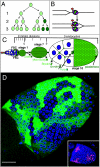
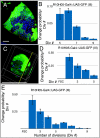
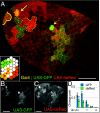
Stem and embryonic cells facilitate programming toward multiple daughter cell fates, whereas differentiated cells resist reprogramming and oncogenic transformation. How alterations in the chromatin-based machinery of epigenetic inheritance contribute to these differences remains poorly known. We observed random, heritable changes in GAL4/UAS transgene programming during Drosophila ovarian follicle stem cell differentiation and used them to measure the stage-specific epigenetic stability of gene programming. The frequency of GAL4/UAS reprogramming declines more than 100-fold over the nine divisions comprising this stem cell lineage. Stabilization acts in cis, suggesting that it is chromatin-based, and correlates with increased S phase length. Our results suggest that stem/early progenitor cells cannot accurately transmit nongenetic information to their progeny; full epigenetic competence is acquired only gradually during early differentiation. Modulating epigenetic inheritance may be a critical process controlling transitions between the pleuripotent and differentiated states.
Conflict of interest statement
The authors declare no conflict of interest.
Figures


Similar articles
-
The progenitor state is maintained by lysine-specific demethylase 1-mediated epigenetic plasticity during Drosophila follicle cell development.Genes Dev. 2014 Dec 15;28(24):2739-49. doi: 10.1101/gad.252692.114. Genes Dev. 2014. PMID: 25512561 Free PMC article.
-
Identification of Genes Mediating Drosophila Follicle Cell Progenitor Differentiation by Screening for Modifiers of GAL4::UAS Variegation.G3 (Bethesda). 2017 Jan 5;7(1):309-318. doi: 10.1534/g3.116.036038. G3 (Bethesda). 2017. PMID: 27866148 Free PMC article.
-
Profiling of DNA and histone methylation reveals epigenetic-based regulation of gene expression during retinal differentiation of stem/progenitor cells isolated from the ciliary pigment epithelium of human cadaveric eyes.Brain Res. 2016 Nov 15;1651:1-10. doi: 10.1016/j.brainres.2016.09.001. Epub 2016 Sep 15. Brain Res. 2016. PMID: 27641993
-
Genetics and epigenetics: stability and plasticity during cellular differentiation.Trends Genet. 2009 Mar;25(3):129-36. doi: 10.1016/j.tig.2008.12.005. Epub 2009 Jan 29. Trends Genet. 2009. PMID: 19185382 Review.
-
Concise review: roles of polycomb group proteins in development and disease: a stem cell perspective.Stem Cells. 2007 Oct;25(10):2498-510. doi: 10.1634/stemcells.2006-0608. Epub 2007 Jun 28. Stem Cells. 2007. PMID: 17600113 Review.
Cited by
-
Unscrambling butterfly oogenesis.BMC Genomics. 2013 Apr 26;14:283. doi: 10.1186/1471-2164-14-283. BMC Genomics. 2013. PMID: 23622113 Free PMC article.
-
New slbo-Gal4 driver lines for the analysis of border cell migration during Drosophila oogenesis.Chromosoma. 2018 Dec;127(4):475-487. doi: 10.1007/s00412-018-0676-7. Epub 2018 Jul 20. Chromosoma. 2018. PMID: 30030602
-
The progenitor state is maintained by lysine-specific demethylase 1-mediated epigenetic plasticity during Drosophila follicle cell development.Genes Dev. 2014 Dec 15;28(24):2739-49. doi: 10.1101/gad.252692.114. Genes Dev. 2014. PMID: 25512561 Free PMC article.
-
Illuminati: a form of gene expression plasticity in Drosophila neural stem cells.Development. 2022 Nov 15;149(22):dev200808. doi: 10.1242/dev.200808. Epub 2022 Nov 18. Development. 2022. PMID: 36399062 Free PMC article.
-
Gene expression profiling identifies the zinc-finger protein Charlatan as a regulator of intestinal stem cells in Drosophila.Development. 2014 Jul;141(13):2621-32. doi: 10.1242/dev.106237. Development. 2014. PMID: 24961799 Free PMC article.
References
-
- Hemberger M, Dean W, Reik W. Epigenetic dynamics of stem cells and cell lineage commitment: Digging Waddington's canal. Nat Rev Mol Cell Biol. 2009;10:526–537. - PubMed
-
- Mohn F, Schübeler D. Genetics and epigenetics: Stability and plasticity during cellular differentiation. Trends Genet. 2009;25:129–136. - PubMed
-
- Chambers I, et al. Nanog safeguards pluripotency and mediates germline development. Nature. 2007;450:1230–1234. - PubMed
Publication types
MeSH terms
Substances
Grants and funding
LinkOut - more resources
Full Text Sources
Other Literature Sources
Medical
Molecular Biology Databases

