. 2010 Apr 20;107(16):7305-10.
doi: 10.1073/pnas.0908269107. Epub 2010 Apr 5.

Three-dimensional distribution of transient interactions in the nuclear pore complex obtained from single-molecule snapshots

Affiliations

Three-dimensional distribution of transient interactions in the nuclear pore complex obtained from single-molecule snapshots

Jiong Ma et al. Proc Natl Acad Sci U S A. .

Abstract

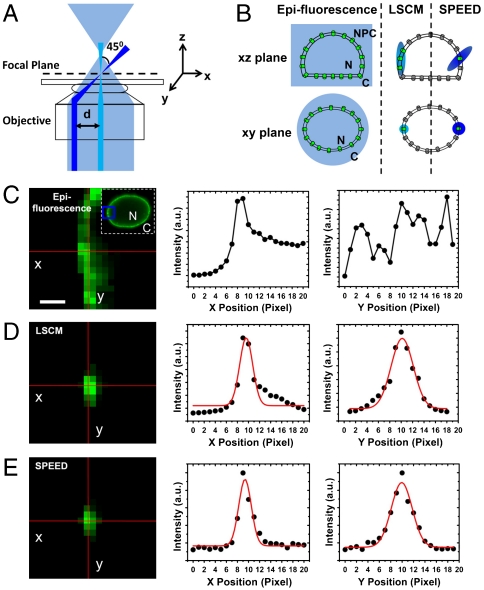
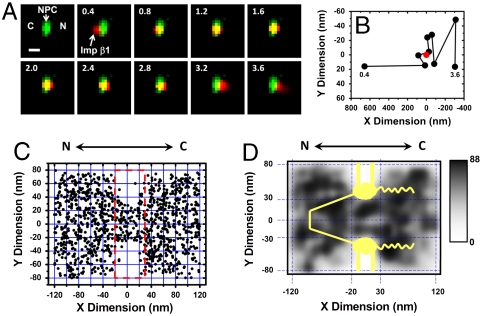
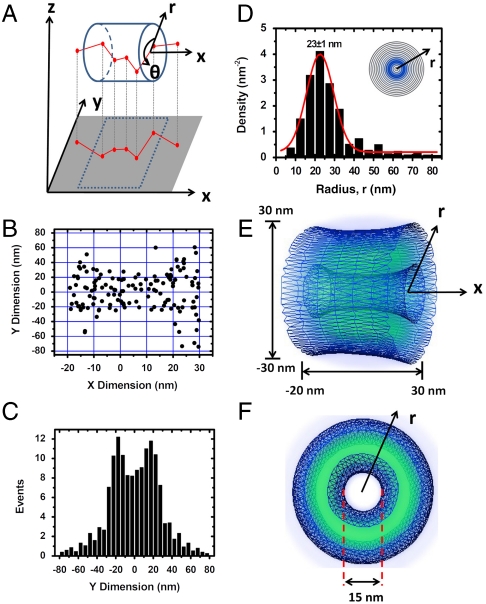
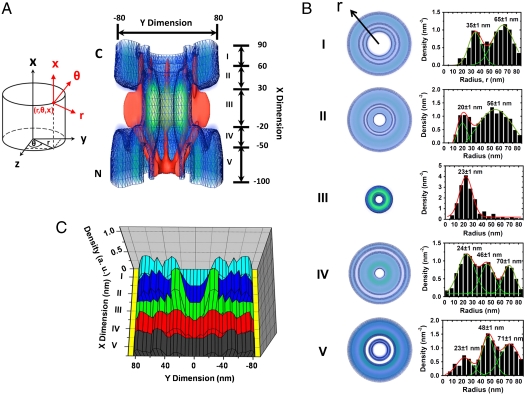
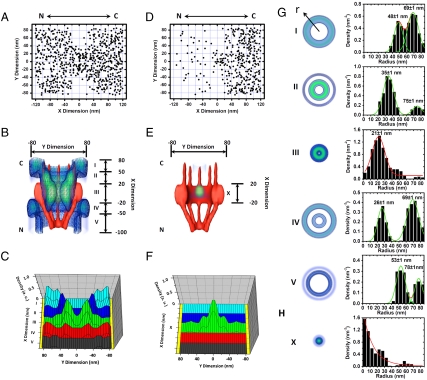
The translocation of large macromolecules through the nuclear pore complex (NPC) of eukaryotic cells is hindered by the phenylalanine-glycine (FG) nucleoporin (Nup) barrier unless molecules are chaperoned by transport receptors. The precise mechanism of facilitated translocation remains unclear due to the challenges of measuring the series of transient interactions between a transport receptor and the FG-Nups. This study developed single-point edge-excitation subdiffraction microscopy to obtain a three-dimensional density map of the transient interactions with a spatiotemporal resolution of 9 nm and 400 mus. Three unique features were observed under real-time trafficking conditions that have escaped detection by conventional electron microscopy: (i) the spatial density of interaction sites between Importin beta1 (Imp beta1, a major transport receptor) and the FG-Nups gradually increases from both sides of the NPC and is highest in the central pore region; (ii) cargo-free or cargo-bound Imp beta1 rarely occupies an axial channel with a diameter of approximately 10-20 nm at its narrowest point through the NPC; and (iii) the pathway of facilitated translocation through the NPC depends more on the interaction sites of the FG-Nups than on the NPC architecture.


Conflict of interest statement

The authors declare no conflict of interest.

Figures

Fig. 1.
Fig. 1.
SPEED microscopy. (A) Optics. The simplified optical diagram illustrates the different excitation beam paths of the SPEED (blue), the LSCM (cyan), and the wide-field epifluorescence (light blue) microscopy. The laser beam in the SPEED microscopy was focused into a diffraction-limited spot in the focal plane (dotted line) from the edge of the objective. An angle of 45° was formed between the iPSFs of the SPEED microscopy and the LSCM when the incident laser beam was shifted 237 μm (d) off the center of the objective (Fig. S2). (B) Illumination volumes in the three microscopes. The diagram demonstrates the NPCs inside (green) and outside (gray) the illumination volume in the xy and xz planes. N, nucleus; C, cytoplasm. (C) Multiple GFP-NPCs were excited using wide-field epifluorescence microscopy. The adopted area is enclosed by the blue box in the image of the entire fluorescent nuclear envelope (Inset). (Scale bar, 1 μm.) (D) GFP-NPCs were illuminated by the LSCM. The fluorescent spot was fit by a Gaussian function in both x and y directions. (E) Only a single GFP-NPC was excited in the illumination volume of the SPEED microscopy.
Fig. 2.
Fig. 2.
Single-molecule trajectories and 2D spatial locations of Imp β1 in single NPCs. (A) A typical nuclear transport event of Imp β1 molecules from the cytoplasm to the nucleus. First, a single GFP-NPC (green spot) was visualized in the illumination volume. Then, a single fluorescent Imp β1 molecule (red spot) entered the illumination volume, starting in the cytoplasm (C), interacting with the NPC, and entering the nucleus (N). Numbers denote time in milliseconds. (Scale bar, 1 μm.) (B) Single-molecule trajectories of the transport event in A. Based on the centroid (red dot) and the dimensions of the NPC, the Imp β1 molecule was determined to interact with the NPC from 0.8 to 2.8 ms. (C) Superimposed plots of 1,093 spatial localizations of single Imp β1 molecules located primarily within a rectangular area of 240 × 160 nm. N, the nucleoplasmic side of the NPC; C, the cytoplasmic side of the NPC. (D) Two-dimensional spatial density map of Imp β1 locations. The locations of Imp β1 in each 20 × 20 nm area were quantized and filtered by a Gaussian blur function. The highest and lowest densities were 88 locations/μm2 and 0 locations/μm2, as shown by the gray level. A diagram of the NPC architecture (yellow) was superimposed on the density map.
Fig. 3.
Fig. 3.
A 2D to 3D deconvolution process. (A) A diagram to show that the obtained 2D spatial locations of Imp β1 are a projection effect of the actual 3D spatial locations of Imp β1 in the xy plane. (B) Two-dimensional spatial locations of Imp β1 in the central pore region enclosed in the red box in Fig. 2C. (C) Histogram of Imp β1 locations in the central pore region in the y dimension. (Bin size, 5 nm.) (D) The obtained histogram of spatial densities along the radius (r) at the cross-section of NPC in the central pore. The radii were used to plot concentric rings. The darker the ring, the higher the density. (Bin size, 5 nm.) (E and F) The obtained 3D spatial densities of Imp β1 (blue shaded region and isolated surface lines, brighter green color indicates higher density) in the central pore.
Fig. 4.
Fig. 4.
A 3D spatial density map of interaction sites between Imp β1 and the FG-Nups. (A) Cutaway view of the 3D spatial density map of Imp β1 (blue shaded region and isolated surface lines, brighter green color indicates higher density) superimposed on the NPC architecture (red). Five regions with distinct spatial location groups for Imp β1 were marked from I to V with relative distances from the centroid of the NPC. Numbers denote the distance in nanometers. The Cartesian and cylindrical coordinate systems are shown. C, the cytoplasmic side of NPC; N, the nucleoplasmic side of NPC. (B) Histograms of spatial densities along the radii (r) at the cross-section of NPC in the range I–V. Major peaks were obtained by Gaussian fittings (green and red lines). (Bin size, 5 nm.) (C) Normalized densities of the interaction sites between Imp β1 and the FG-Nups in range I–V.
Fig. 5.
Fig. 5.
Three-dimensional pathways for the import cargo complex and cargo alone. (A) Superimposed plots of 938 spatial localizations of single import cargo complexes located primarily within a rectangular area of 240 × 160 nm. N, the nucleoplasmic side of the NPC; C, the cytoplasmic side of the NPC. (B) Cutaway view of the 3D spatial density map of the import cargo complex (blue shaded region and isolated surface lines, brighter green color indicates higher density) superimposed on the NPC architecture (red). (C) Normalized densities of the interaction sites between the import cargo complexes and the FG-Nups in the range I–V. (D) Superimposed plots of 417 spatial localizations of single cargo molecules located within a rectangular area of 240 × 160 nm. (E) A 3D view of the inhibition barrier for cargo molecules (blue and green clouds) within the NPC architecture (red). (F) Normalized spatial densities of cargo locations. (G) Histograms of spatial densities for import complexes along the radii (r) at the cross-section of NPC in range I–V. (Bin size, 5 nm.) (H) Histogram of the spatial densities for cargo alone at the cross-section of NPC in range X. The histogram can be roughly fitted by an exponential decay function (red line). (Bin size, 5 nm.)

Similar articles

Cited by

References

    1. Weis K. Regulating access to the genome: Nucleocytoplasmic transport throughout the cell cycle. Cell. 2003;112:441–451. - PubMed
    1. Fried H, Kutay U. Nucleocytoplasmic transport: Taking an inventory. Cell Mol Life Sci. 2003;60:1659–1688. - PMC - PubMed
    1. Fahrenkrog B, Aebi U. The nuclear pore complex: Nucleocytoplasmic transport and beyond. Nat Rev Mol Cell Biol. 2003;4:757–766. - PubMed
    1. Beck M, et al. Nuclear pore complex structure and dynamics revealed by cryoelectron tomography. Science. 2004;306:1387–1390. - PubMed
    1. Rout M-P, Blobel G. Isolation of the yeast nuclear pore complex. J Cell Biol. 1993;123:771–783. - PMC - PubMed

Publication types

LinkOut - more resources