. 2010 Apr 12;207(4):855-65.
doi: 10.1084/jem.20100244. Epub 2010 Apr 5.

53BP1 regulates DNA resection and the choice between classical and alternative end joining during class switch recombination

Affiliations

53BP1 regulates DNA resection and the choice between classical and alternative end joining during class switch recombination

Anne Bothmer et al. J Exp Med. .

Abstract

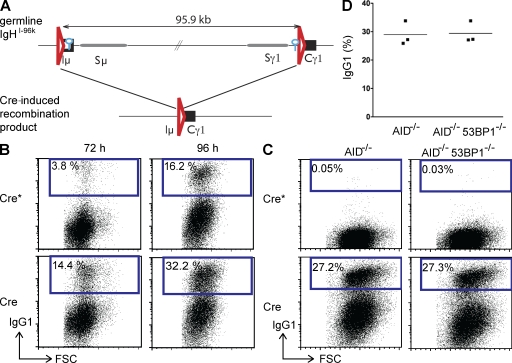
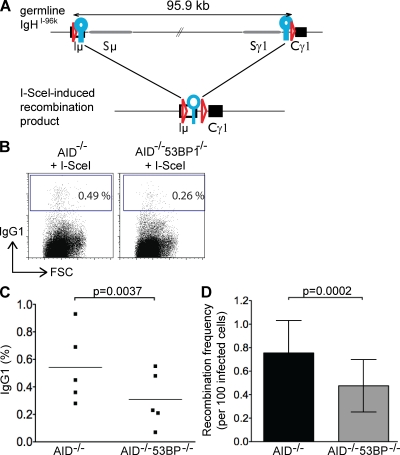
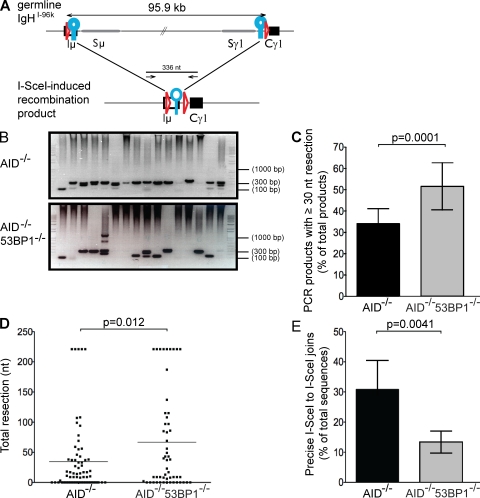
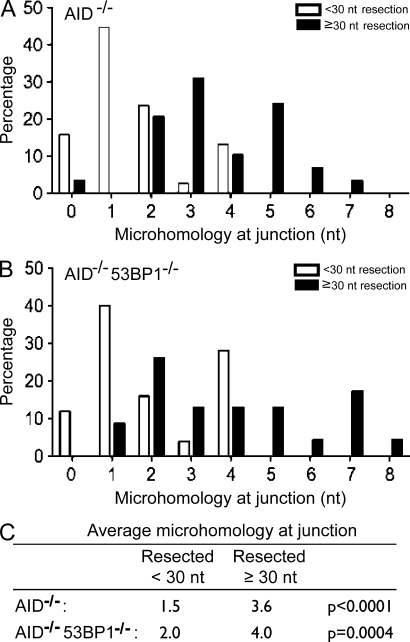
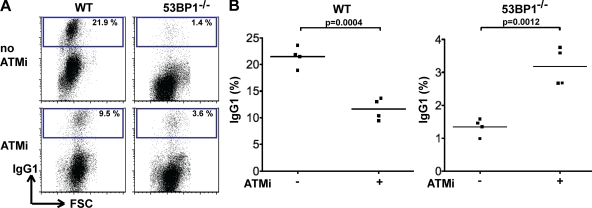
Class switch recombination (CSR) diversifies antibodies by joining highly repetitive DNA elements, which are separated by 60-200 kbp. CSR is initiated by activation-induced cytidine deaminase, an enzyme that produces multiple DNA double-strand breaks (DSBs) in switch regions. Switch regions are joined by a mechanism that requires an intact DNA damage response and classical or alternative nonhomologous end joining (A-NHEJ). Among the DNA damage response factors, 53BP1 has the most profound effect on CSR. We explore the role of 53BP1 in intrachromosomal DNA repair using I-SceI to introduce paired DSBs in the IgH locus. We find that the absence of 53BP1 results in an ataxia telangiectasia mutated-dependent increase in DNA end resection and that resected DNA is preferentially repaired by microhomology-mediated A-NHEJ. We propose that 53BP1 favors long-range CSR in part by protecting DNA ends against resection, which prevents A-NHEJ-dependent short-range rejoining of intra-switch region DSBs.


Figures

Figure 1.
Figure 1.
Cre recombinase induces efficient CSR to IgG1 independently of AID and 53BP1. (A) Schematic representation of the IgHI-96k allele (top) and the Cre-induced recombinant that encodes IgG1 (bottom). LoxP sites are indicated as red triangles, and I-SceI sites are indicated as blue circles. (B) Representative flow cytometry experiments showing CSR to IgG1 of IgHI-96k B cells infected with retroviruses encoding Cre or catalytically inactive Cre*. IgG1 expression was analyzed at 72 and 96 h after LPS and IL-4 stimulation. (C) Experiment as in B but for IgHI-96kAID−/− and IgHI-96kAID−/−53BP1−/− B cells analyzed at 96 h after LPS and IL-4 stimulation. (D) Graph shows the results of three independent flow cytometry experiments measuring CSR to IgG1 after Cre infection of IgHI-96AID−/− and IgHI-96kAID−/−53BP1−/− B cells. The means are shown as horizontal lines. FSC, forward scatter.
Figure 2.
Figure 2.
Loss of 53BP1 decreases the joining efficiency of two distal I-SceI–induced DSBs. (A) Schematic representation of the IgHI-96k allele (top) and the I-SceI–induced recombinant that encodes IgG1 (bottom). LoxP sites are indicated as red triangles, and I-SceI sites are indicated as blue circles. (B) Representative flow cytometry experiments showing CSR to IgG1 of IgHI-96kAID−/− and IgHI-96kAID−/−53BP1−/− B cells 72 h after the first infection with an I-SceI–encoding retrovirus. (C) Graph shows the results of five independent flow cytometry experiments, with each dot representing an individual experiment. The p-value was calculated using a two-tailed paired Student’s t test. The means are shown as horizontal lines. (D) Bar graph showing I-SceI to I-SceI recombination frequency in the presence and absence of 53BP1, determined by nine independent PCR experiments. Error bars indicate standard deviation. The p-value was calculated using a two-tailed paired Student’s t test. FSC, forward scatter.
Figure 3.
Figure 3.
Loss of 53BP1 leads to increased end resection. (A) Schematic representation of IgHI-96k allele (top) with the PCR primers used to amplify a 336-nt recombination product, indicated as arrows (bottom). LoxP sites are indicated as red triangles, and I-SceI sites are indicated as blue circles. (B) Representative ethidium bromide–stained argarose gels showing PCR products obtained after I-SceI–induced recombination in IgHI-96kAID−/− and IgHI-96kAID−/−53BP1−/− B cells. (C) Bar graphs showing frequency of I-SceI–induced recombination products running ≤300 nt for IgHI-96kAID−/− and IgHI-96kAID−/−53BP1−/− B cells, determined by 12 independent PCR experiments. Error bars indicate standard deviation. The p-value was calculated using a two-tailed Student’s t test. (D) Dot plot showing total resection of I-SceI–infected IgHI-96kAID−/− and IgHI-96kAID−/−53BP1−/− B cells. Each dot represents one sequence. The p-value was calculated using a two-tailed Student’s t test. The means are shown as horizontal lines. (E) Bar graph shows the frequency of perfect I-SceI joins in I-SceI–infected IgHI-96kAID−/− and IgHI-96kAID−/−53BP1−/− B cells in five independent experiments. Error bars indicate standard deviation. The p-value was calculated using a two-tailed Student’s t test.
Figure 4.
Figure 4.
Resected DSBs are joined using microhomology-mediated end joining independently of 53BP1. (A) Bar graph shows microhomology at junctions of PCR products cloned from I-SceI–infected IgHI-96kAID−/− B cells. White bars indicate sequences with little resection (<30 nt), and black bars indicate sequences with resection ≥30 nt. A total of 67 individual sequences were analyzed from three different mice. (B) Bar graph shows microhomology at junctions of PCR products cloned from I-SceI–infected IgHI-96kAID−/−53BP1−/− B cells. White bars indicate sequences with little resection (<30 nt), and black bars indicate sequences with resection ≥30 nt. A total of 48 individual sequences were analyzed from three different mice. (C) Table indicates the mean number of nucleotides of microhomology at junctions in I-SceI–infected IgHI-96kAID−/− and IgHI-96kAID−/−53BP1−/− B cells.
Figure 5.
Figure 5.
Increased DNA end resection in the absence of 53BP1 is dependent on ATM. (A) Representative flow cytometry experiment showing CSR to IgG1 by IgHI-96kAID−/− B cells infected with an I-SceI–encoding retrovirus in the presence or absence of ATMi. (B) Graph shows the results of three independent flow cytometry experiments, with each dot representing an individual experiment. The means are shown as horizontal lines. (C) Representative ethidium bromide–stained argarose gels showing the PCR amplification products after I-SceI–induced recombination of IgHI-96kAID−/− and IgHI-96kAID−/−53BP1−/− B cells in the presence or absence of ATMi. (D) Bar graph showing the frequency of I-SceI–induced recombination products running ≤300 nt for IgHI-96kAID−/− and IgHI-96kAID−/−53BP1−/− B cells in the presence or absence of ATMi. Error bars indicate standard deviation. p-values were calculated using a two-tailed Student’s t test (three independent experiments). (E) Frequency of direct I-SceI joins, reconstituting an I-SceI site, determined by sequencing of individual molecular products of I-SceI–infected IgHI-96kAID−/− and IgHI-96kAID−/− 53BP1−/− B cells in the presence or absence of ATMi. Error bars indicate standard deviation. p-values were calculated using a two-tailed Student’s t test (three independent sequencing experiments). FSC, forward scatter.
Figure 6.
Figure 6.
Inhibition of ATM leads to partial rescue of the CSR defect in 53BP1−/− B cells. (A) Representative flow cytometry experiment showing CSR to IgG1 by WT and 53BP1−/− B cells 96 h after LPS, IL-4, and RP105 stimulation in the presence or absence of ATMi. (B) Graph summarizes CSR to IgG1 by WT and 53BP1−/− B cells in four independent experiments in the presence or absence of ATMi. The means are shown as horizontal lines. p-values were calculated using a two-tailed Student’s t test. FSC, forward scatter.

References

    1. Boboila C., Jankovic M., Yan C.T., Wang J.H., Wesemann D.R., Zhang T., Fazeli A., Feldman L., Nussenzweig A., Nussenzweig M., Alt F.W. 2010a. Alternative end-joining catalyzes robust IgH locus deletions and translocations in the combined absence of ligase 4 and Ku70. Proc. Natl. Acad. Sci. USA. 107:3034–3039 - PMC - PubMed
    1. Boboila C., Yan C.T., Wesemann D.R., Jankovic M., Wang J.H., Manis M.J., Nussenzweig A., Nussenzweig M., Alt F.W. 2010b. Alternative end-joining catalyzes class switch recombination in the absence of both Ku70 and DNA ligase 4. J. Exp. Med. 207:417–427 - PMC - PubMed
    1. Bransteitter R., Pham P., Scharff M.D., Goodman M.F. 2003. Activation-induced cytidine deaminase deaminates deoxycytidine on single-stranded DNA but requires the action of RNase. Proc. Natl. Acad. Sci. USA. 100:4102–4107 10.1073/pnas.0730835100 - DOI - PMC - PubMed
    1. Callén E., Jankovic M., Difilippantonio S., Daniel J.A., Chen H.T., Celeste A., Pellegrini M., McBride K., Wangsa D., Bredemeyer A.L., et al. 2007. ATM prevents the persistence and propagation of chromosome breaks in lymphocytes. Cell. 130:63–75 10.1016/j.cell.2007.06.016 - DOI - PubMed
    1. Catalan N., Selz F., Imai K., Revy P., Fischer A., Durandy A. 2003. The block in immunoglobulin class switch recombination caused by activation-induced cytidine deaminase deficiency occurs prior to the generation of DNA double strand breaks in switch mu region. J. Immunol. 171:2504–2509 - PubMed

Publication types

MeSH terms

Substances