Case Reports
. 2010 Apr 12;207(4):731-50.
doi: 10.1084/jem.20091488. Epub 2010 Apr 5.

Targeting iron homeostasis induces cellular differentiation and synergizes with differentiating agents in acute myeloid leukemia

Affiliations
Case Reports

Targeting iron homeostasis induces cellular differentiation and synergizes with differentiating agents in acute myeloid leukemia

Celine Callens et al. J Exp Med. .

Abstract

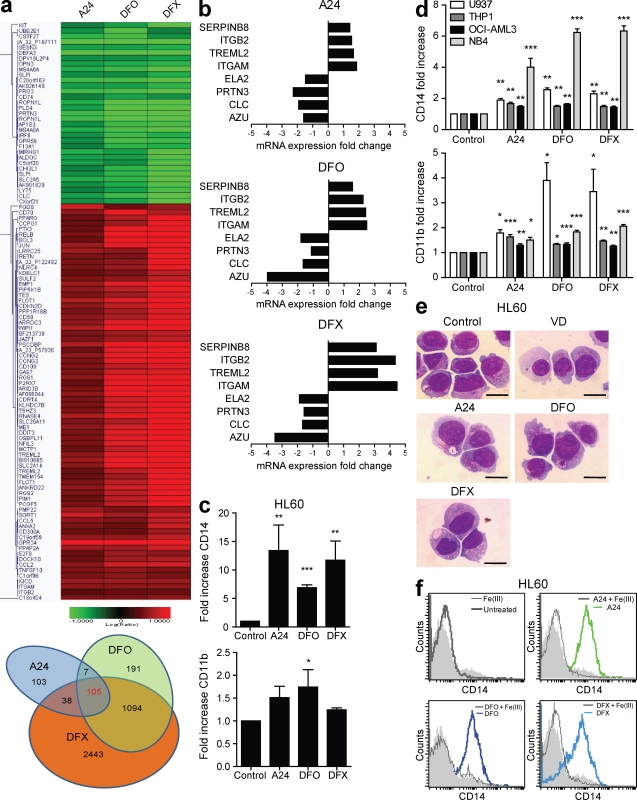
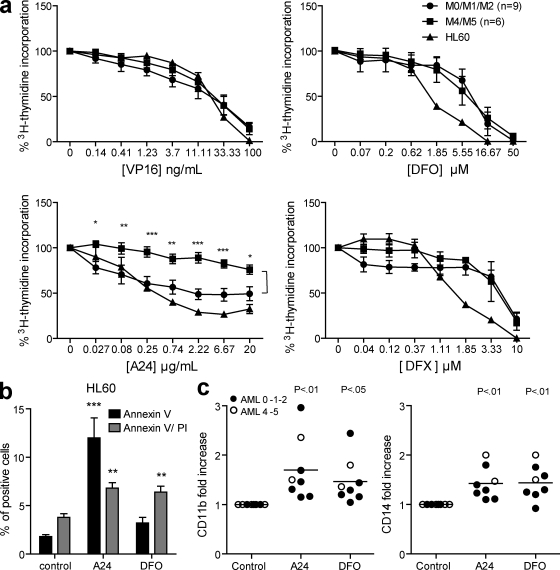
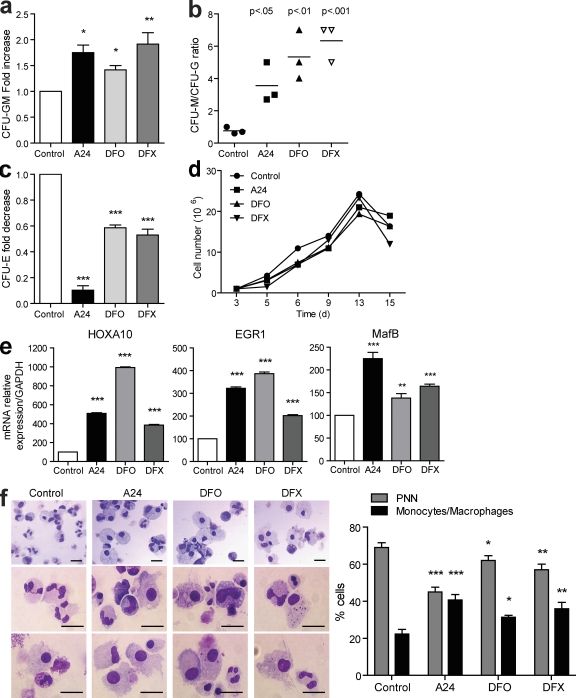
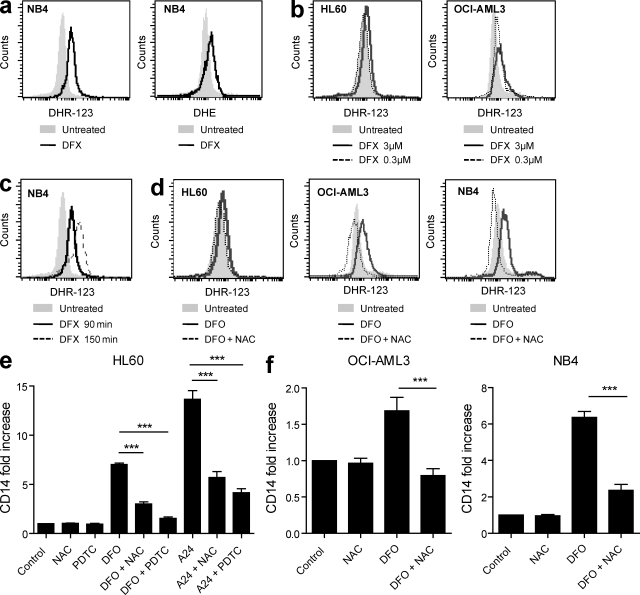
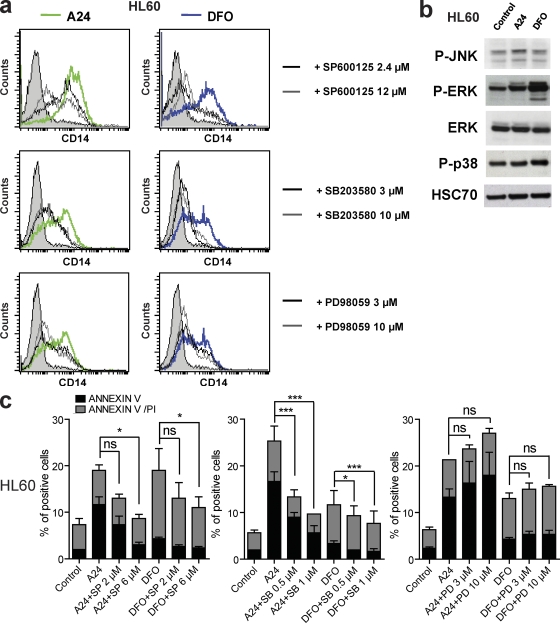
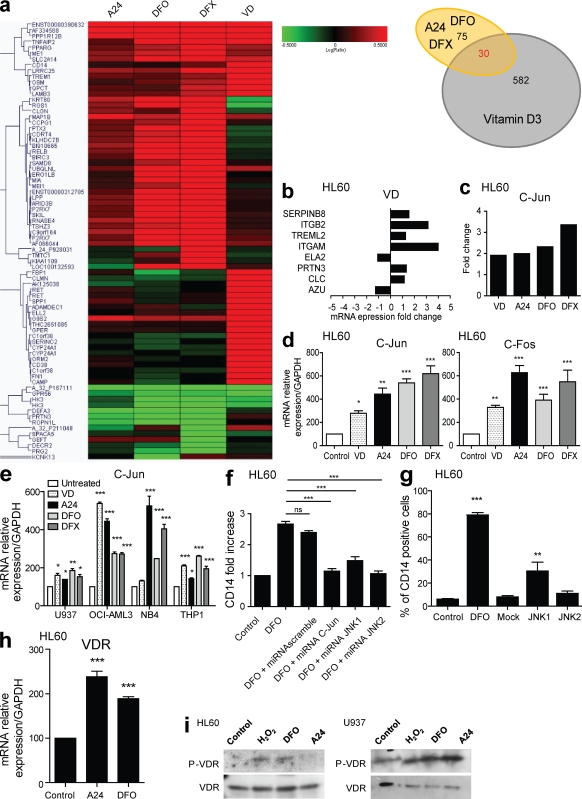
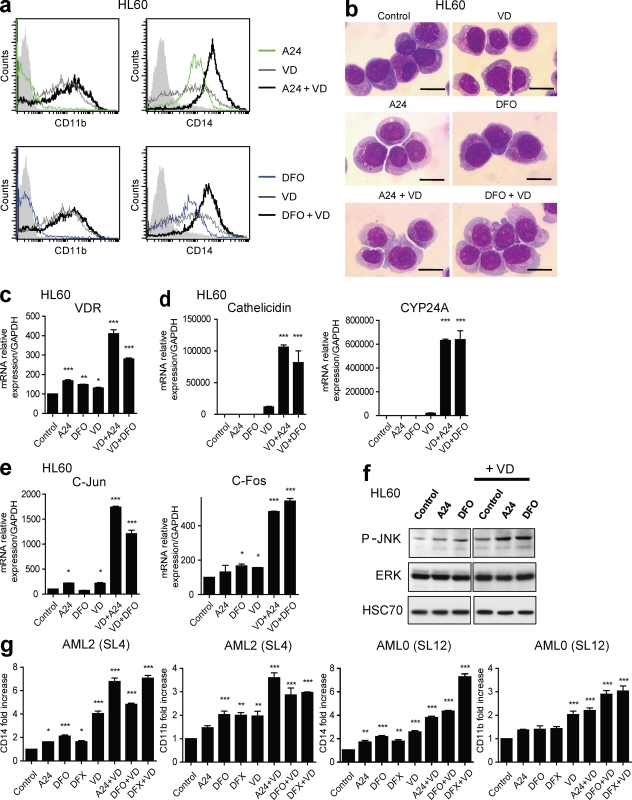
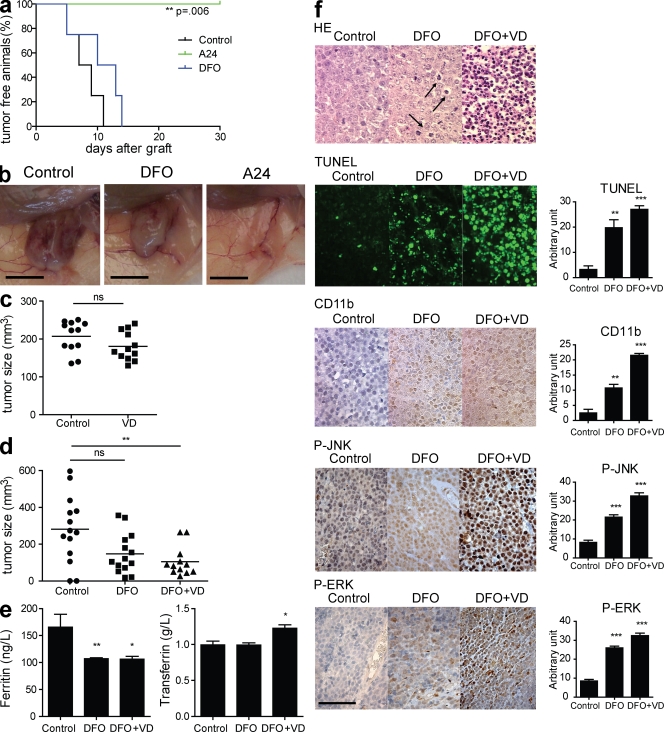
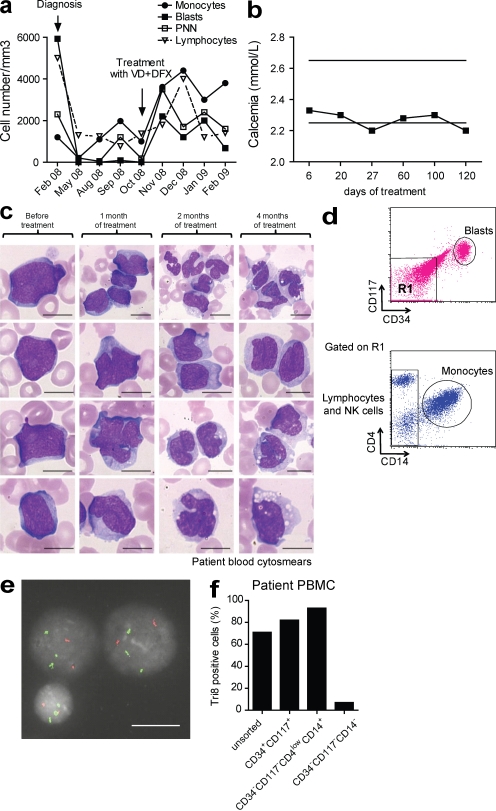
Differentiating agents have been proposed to overcome the impaired cellular differentiation in acute myeloid leukemia (AML). However, only the combinations of all-trans retinoic acid or arsenic trioxide with chemotherapy have been successful, and only in treating acute promyelocytic leukemia (also called AML3). We show that iron homeostasis is an effective target in the treatment of AML. Iron chelating therapy induces the differentiation of leukemia blasts and normal bone marrow precursors into monocytes/macrophages in a manner involving modulation of reactive oxygen species expression and the activation of mitogen-activated protein kinases (MAPKs). 30% of the genes most strongly induced by iron deprivation are also targeted by vitamin D3 (VD), a well known differentiating agent. Iron chelating agents induce expression and phosphorylation of the VD receptor (VDR), and iron deprivation and VD act synergistically. VD magnifies activation of MAPK JNK and the induction of VDR target genes. When used to treat one AML patient refractory to chemotherapy, the combination of iron-chelating agents and VD resulted in reversal of pancytopenia and in blast differentiation. We propose that iron availability modulates myeloid cell commitment and that targeting this cellular differentiation pathway together with conventional differentiating agents provides new therapeutic modalities for AML.


Figures

Figure 1.
Figure 1.
Iron deprivation induces monocyte differentiation of AML cells. (a) Unsupervised microarray analysis of HL60 cells after a 48-h exposure to 10 µg/ml of anti-TfR1 antibody (mAb A24), 5 µM DFO, or 3 µM DFX. The color intensity represents the ratio of expression in drug-treated compared with control cells. The relative overexpression and underexpression compared with controls are shown in red and green, respectively (top). A Venn diagram of genes induced by iron deprivation (bottom) shows that only a subset of genes (105) have a shared altered expression between the different iron deprivation treatments, in contrast to many genes (1,094) that are altered by the iron chelators DFO and DFX. Genes with an intensity >50 and a p-value <0.001 were considered relevant. (b) Fold change variations of gene expression in differentiated cells relative to untreated cells. A24 and the iron chelators up-regulated monocyte/macrophage-specific genes and down-regulated myelocyte-specific genes. Up-regulation is represented on the positive scale, and down-regulation is indicated on the negative scale. (c) Fold increase of CD14 and CD11b expression after flow cytometry (mean fluorescence intensity [MFI] relative to untreated cells) in HL60 cell line treated with 10 µg/ml A24, 5 µM DFO, or 3 µM DFX for 72 h (mean ± SEM, n = 3). (d) Fold increase of CD14 and CD11b expression evaluated by flow cytometry (MFI relative to untreated cells) in U937 (white), THP1 (dark gray), OCI-AML3 (black), and NB4 (light gray) cell lines treated with 10 µg/ml A24, 5 µM DFO, or 3 µM DFX for 72 h (mean ± SEM, n = 3). (e) MGG-stained cytospins of HL60 cells treated with 250 nM VD, 10 µg/ml A24, 5 µM DFO, or 3 µM DFX for 72 h. The control cells show an immature myeloblastic phenotype: a high nucleus-to-cytoplasm ratio, a hyperbasophilic cytoplasm, and numerous azurophilic granules. The A24- or iron chelator–treated cells show a decrease in the nucleus-to-cytoplasm ratio, the loss of granules, and cytoplasmic basophilia and irregular cytoplasmic contours, all typical of mature monocytes. Bars, 10 µm. Representative photos of three independent experiments are shown. (f) FACS analysis of CD14 expression in HL60 cells treated with A24 (green line), DFO, and DFX (blue lines) in the presence or absence of 5 µM FeCl3 (gray line) for 72 h. The filled histograms represent staining with the isotype control antibody. One representative experiment of three experiments is shown. *, P < 0.05; **, P < 0.01; ***, P < 0.001.
Figure 2.
Figure 2.
Iron deprivation inhibits proliferation and induces differentiation of AML blasts. (a) Fresh AML blasts or HL60 cells were cultured with increasing concentrations of A24 (0–20 µg/ml), DFO (0–50 µM), DFX (0–10 µM), or VP16 (0–100 ng/ml) for 72 h, followed by a 16-h period of [3H]-thymidine incorporation. Thymidine incorporation (percentage over the control) was plotted as the mean ± SEM of grouped M0/M1/M2 (n = 6) or M4/M5 (n = 9) subtypes patients. Cell proliferation for each patient was measured in triplicate. (b) HL60 cells were cultured in the presence or absence of 10 µg/ml A24 or 5 µM DFO for 72 h. Early and late apoptosis was evaluated by flow cytometry using annexin V–FITC/PI labeling (mean ± SEM, n = 3). *, P < 0.05; **, P < 0.01; ***, P < 0.001. (c) CD14 and CD11b expression in blasts from AML patients treated with A24 and DFO for 72 h. The expression of the differentiation markers was normalized by calculating the fold increase of the MFI relative to the control cells. The filled symbols represent the M0/M1/M2 AML subtypes, and the M4/M5 subtypes are empty symbols. One representative experiment of three is presented for each patient. The mean (horizontal bars) of the eight patients is shown.
Figure 3.
Figure 3.
Iron deprivation induces the differentiation of primary progenitors into monocytes. CD34+ cord blood progenitors were plated in methylcellulose containing a cocktail of cytokines (Epo, SCF, IL-3, G-CSF, and GM-CSF) in the presence or absence of 10 µg/ml A24, 5 µM DFO, or 3 µM DFX. After 14 d, colonies of each lineage were counted (mean ± SEM, n = 3). (a and b) Variations of colonies are represented as the fold increase of CFU-GM (a) or the ratio of CFU-M/CFU-G (b). (c) Fold decrease of CFU-E. (d) Cell numbers and viability measured by Trypan blue dye exclusion during culture. One representative experiment of three is shown. All counts were performed in triplicates. (e) After 48 h of culture, the mRNA expression of HOXA10, EGR1, and MAFB was quantified by quantitative RT-PCR and normalized to the expression of GAPDH (mean ± SEM, n = 3). (f) Representative photos taken at the end of culture (day 18) are shown. Polymorphonuclear neutrophils are present in the majority of the control cultures, whereas monocytes and macrophages are predominantly present under iron deprivation conditions. The histograms represent the percentage of each leukocyte population from MGG-colored cytospins at day 18 (mean ± SEM, three independent counts of 100 cells each). Bars, 10 µm. *, P < 0.05; **, P < 0.01; ***, P < 0.001.
Figure 4.
Figure 4.
Modulation of ROS levels controls monocyte differentiation in AML cells. (a) Representative flow cytometry analysis showing ROS production by NB4 cells. Cells were stained for 30 min at 37°C with 0.5 µM DHR123 or 1 µM DHE and further treated with 3 µM DFX (continuous line) or not (filled histograms) for 90 min. One representative experiment of three is presented. (b) ROS production in AML cell lines (HL60 and OCI-AML3 cells) is dose dependent. Cells were labeled with DHR123 (as described in a) and treated with 3 µM DFX (continuous line) or 0.3 µM DFX (dashed line) for 90 min or not (filled histograms). One representative experiment of three is presented. (c) Time-dependent production of ROS. NB4 cells were treated with 3 µM DFX for 90 min (continuous line) or 150 min (dashed line). ROS production was evaluated by flow cytometry. One representative experiment of three is presented. (d) Representative flow cytometry data showing specificity of the ROS production by NB4 cells. Cells were stained for 30 min at 37°C with 0.5 µM DHR123 and further treated with 3 µM DFO. Abrogated ROS detection is shown in cell cultures where DFO was added in the presence of the anti-oxidant NAC (dashed line) as compared with control untreated cells (filled histogram). One representative experiment of three is presented. (e) CD14 expression (fold change) in HL60 cells treated with 10 µg/ml A24 and 5 µM DFO in the presence or absence of the anti-oxidant agents (NAC and PDTC) for 72 h (mean ± SEM, n = 3). (f) CD14 expression in OCI-AML3 and NB4 cells treated with DFO in the presence or in the absence of the anti-oxidant agent NAC for 72 h (mean ± SEM, n = 3). ***, P < 0.001.
Figure 5.
Figure 5.
Cell differentiation and apoptosis are controlled by MAPK activation. (a) CD14 expression on HL60 cells cultured in the presence or absence of A24 (green) or DFO (blue) and treated with a JNK inhibitor (SP600125) at 2.4 or 12 µM, with a p38 inhibitor (SB203580) or an ERK inhibitor (PD98059) at 3 or 10 µM, or mock treated for 72 h. Filled histograms represent staining with the isotype control antibody. One representative experiment of three experiments is shown. (b) Serum-starved HL60 cells were incubated with 10 µg/ml A24 or 3 µM DFO for 30 min at 37°C. Whole cell extracts were analyzed by immunoblotting, demonstrating the phosphorylation of JNK (p-JNK), ERK (p-ERK), and p38 (p-p38). One representative experiment of three experiments is shown. HSC70 and ERK were used as equal loading controls. (c) Histograms representing early and late apoptosis/necrosis using flow cytometry with annexin V–FITC/PI labeling. HL60 cells were cultured for 72 h in the presence or absence of 10 µg/ml A24 or 5 µM DFO and treated with 2 or 6 µM JNK inhibitor (SP600125 [SP]), 0.5 or 1 µM p38 inhibitor (SB203580 [SB]), 3 or 10 µM ERK inhibitor (PD98059 [PD]), or mock treated (mean ± SEM, n = 3). *, P < 0.05; ***, P < 0.001.
Figure 6.
Figure 6.
Cellular differentiation induced by iron deprivation is dependent on the activation of the JNK and VDR signaling pathways. (a) Hierarchical gene clustering by unsupervised microarray analysis in HL60 cells treated with 250 nM VD or iron chelating agents (A24, 10 µg/ml; DFO, 5 µM or DFX, 3 µM). Only genes with a fold change >4 and a p-value <10−15 are shown (left). A Venn diagram is shown, demonstrating that among the 105 genes that were specifically induced by iron deprivation, 30 were modified by treatment with VD (right). (b) Histograms representing the variation of expression (fold change relative to untreated cells) of genes found in mature monocytes (up-regulated) or neutrophils (down-regulated) that were previously modified by A24 and the iron chelators. These genes are similarly regulated by VD treatment. Up-regulation of gene transcription is represented on the positive scale, and down-regulation is shown on the negative scale. (c) Genechip fold change in c-Jun expression after treatment with VD or iron deprivation. (d) c-Fos and c-Jun mRNA levels evaluated by quantitative RT-PCR and normalized to GAPDH mRNA in HL60 cells treated for 48 h with the indicated agents (VD, 250 nM; A24, 10 µg/ml; DFO, 5 µM or DFX, 3 µM; mean ± SEM, n = 4). (e) c-Jun mRNA level evaluated by quantitative RT-PCR and normalized to GAPDH mRNA in U937, OCI-AML3, NB4, and THP1 cell lines treated for 48 h with the indicated agents (VD, 250 nM; A24 10 µg/ml; DFO, 5 µM or DFX, 3 µM; mean ± SEM, n = 4). (f) Fold increase of CD14 expression in HL60 cells transfected with the indicated miRNA constructs: scrambled control miRNA, miRNA-C-Jun, miRNA-JNK1, or miRNA-JNK2. 48 h later, each transfected cells were treated with 5 µM DFO to induce cell differentiation. CD14 expression was evaluated by flow cytometry gating on cells on the basis of their GFP expression 72 h after transfection (mean ± SEM, n = 3). (g) Percentage of differentiated cells induced in HL60 treated for 72 h with DFO or transfected with JNK1-GFP and JNK2-GFP expression plasmids or mock electroporated. CD14 expression was evaluated 72 h after treatments (mean ± SEM, n = 3). (h) VDR mRNA level evaluated by quantitative RT-PCR and normalized to GAPDH mRNA in HL60 cells treated for 48 h with the indicated agents (A24, 10 µg/ml or DFO, 5 µM; mean ± SEM, n = 4). *, P < 0.05; **, P < 0.01; ***, P < 0.001. (i) Serum-starved HL60 and U937 cells were incubated with 0.5 µM H2O2, 10 µg/ml A24, or 3 µM DFO for 10 min at 37°C. Phosphorylation of VDR (P-VDR) in whole cell extracts was analyzed by immunoblotting. VDR was used as loading control. One representative experiment of three is shown.
Figure 7.
Figure 7.
VD synergizes with iron deprivation agents to activate the Jun pathway and induce cellular differentiation. (a) Flow cytometric analysis of CD14 and CD11b expression on HL60 cells treated with 10 µg/ml A24 (green line) or 5 µM DFO (blue line), with 250 nM VD (gray lines) or a combination of VD and iron-chelating agents (black lines) for 72 h. The filled histograms represent staining with the isotype control antibody. One representative experiment of three is shown. (b) HL60 cells were incubated with 10 µg/ml A24 or 3 µM DFO and treated with 250 nM VD or mock treated for 72 h. Cytospins for the treated cells were stained with MGG. Monocyte differentiation is observed with the loss of granulation and basophilia, vacuole appearance, and cytoplasm enlargement. Bars, 10 µM. Representative photos of three independent experiments are shown. (c) The VDR mRNA level, evaluated by quantitative RT-PCR and normalized to GAPDH in HL60 cells treated for 6 h with the indicated agents (A24, 10 µg/ml; DFO, 5 µM; or VD, 250 nM; mean ± SEM, n = 4). (d) The mRNA level of Cathelicidin and CYP24A, evaluated by quantitative RT-PCR and normalized to GAPDH, in HL60 cells treated for 6 h with the indicated agents (A24, 10 µg/ml; DFO, 5 µM; or VD, 250 nM; mean ± SEM, n = 4). (e) The mRNA level of c-Fos and c-Jun genes, evaluated by quantitative RT-PCR and normalized to GAPDH, in HL60 cells treated for 16 h with A24, DFO, and VD as described in c (mean ± SEM, n = 4). (f) Serum-starved HL60 cells were incubated with 10 µg/ml A24 or 3 µM DFO and treated with 250 nM VD or mock treated for 30 min at 37°C. Whole cell extracts from the treated cells were analyzed by immunoblotting, demonstrating the increased phosphorylation of JNK when VD is combined with A24 or DFO. HSC70 and total ERK were used as loading controls. One representative experiment of three is shown. (g) Fold increase of CD14 and CD11b expression analyzed by flow cytometry (MFI relative to untreated cells) in primary blasts from two AML patients, identified as SL4 (AML2 FAB subtype) and SL12 (AML0 FAB subtype). Cells were treated with 10 µg/ml A24, 5 µM DFO, 3 µM DFX, or 250 nM VD or their association as indicated for 72 h (mean ± SEM, n = 3). *, P < 0.05; **, P < 0.01; ***, P < 0.001.
Figure 8.
Figure 8.
Anti-tumor effect of iron deprivation combined with VD in Nude mice. (a) Kaplan-Meier plot of the percentage of tumor-free mice among mice treated with vehicle (control), A24 (single intravenous dose of 40 mg/kg), and DF0 (20 mg 5×/wk) after subcutaneous xenograft with HL60 cells (n = 4 in each group). The p-value was determined using the log-rank test. One representative experiment of three is shown. (b) Representative photographs of xenografted tumors from Fig. 5 a. Bars, 10 mm. (c) Tumor size (measured at day 25) in HL60 cells xenografted in Nude mice. Individual tumor sizes are plotted. The horizontal bars represent the mean of each group (n = 12 in the control group, n = 12 in VD group). One representative experiment of three is shown. (d) Tumor size measured at day 25 in xenografted mice. Individual tumor sizes are plotted. The horizontal bars represent the mean of each group (n = 14 in the control group, n = 14 in the DFO group, and n = 12 in the DFO + VD group). (e) Serum ferritin and transferrin levels in xenografted mice. 25 d after the engraftment, the mice were euthanized, and serum was collected for biochemical analysis (mean ± SEM). (f) Sections of tumors from mice injected with vehicle, DFO, and DFO + VD were stained by HE, TUNEL, or labeled with CD11b-, p-ERK– or p-JNK–specific antibodies. The arrows indicate apoptosis. Representative photos of one experiment are shown. Data were quantified using Image J software. Bar, 50 µm. Histograms represent quantification of at least four different fields. One representative experiment is shown (mean ± SEM). *, P < 0.05; **, P < 0.01; ***, P < 0.001.
Figure 9.
Figure 9.
Iron chelation therapy in combination with VD treatment induced blast differentiation in a refractory AML/MDS patient. (a) Curves representing the blood counts during treatment. The diagnosis and the beginning of the combination therapy are represented with arrows. (b) Plasma calcium concentration during the treatment. Horizontal bars represent minimal and maximal physiological levels of calcemia. (c) MGG-stained blood cytosmears during treatment. At diagnosis, undifferentiated blasts were predominantly observed in MGG-stained blood cytosmears. 1 mo after beginning treatment, the blasts started to present signs of monocyte differentiation, such as nuclear deformation, cytoplasm enlargement, and the presence of vacuoles. After 3 mo of treatment, undifferentiated blasts were replaced by monocytoid blasts and pro-monocytes. After 4 mo, some monoblasts were still detected, but mature monocytes were predominantly observed. Representative photos of each blood cytosmears are shown. (d) The differentiation potential of blasts treated with combination therapy was evaluated in circulating cells after 3 mo of treatment. PBMCs were isolated, and the cell populations were sorted as follows: blasts (CD34+CD117+); monocytes (CD34CD117CD4lowCD14+); and lymphocytes and NK cells (CD34CD117CD14). The cells were further processed for cytogenetic analysis. (e) FISH analysis. Representative images of chromosomes 8 (green) and 12 (red) probed by fluorescent in situ hybridization demonstrating the trisomy 8 present in the monocytes. (f) Percentage of trisomy 8–positive cells in sorted fractions from d, demonstrating that the monocytes, but not the lymphocytes and NK cells, originated from the blast pool.

Comment in

  • Metabolism and the leukemic stem cell.
    Abdel-Wahab O, Levine RL. Abdel-Wahab O, et al. J Exp Med. 2010 Apr 12;207(4):677-80. doi: 10.1084/jem.20100523. Epub 2010 Apr 5. J Exp Med. 2010. PMID: 20368582 Free PMC article.

References

    1. Abe E., Miyaura C., Sakagami H., Takeda M., Konno K., Yamazaki T., Yoshiki S., Suda T. 1981. Differentiation of mouse myeloid leukemia cells induced by 1 alpha,25-dihydroxyvitamin D3. Proc. Natl. Acad. Sci. USA. 78:4990–4994 10.1073/pnas.78.8.4990 - DOI - PMC - PubMed
    1. Adamson J.W. 1994. The relationship of erythropoietin and iron metabolism to red blood cell production in humans. Semin. Oncol. 21:9–15 - PubMed
    1. Agramonte-Hevia J., Hallal C., Garay-Canales C., Guerra-Araiza C., Camacho-Arroyo I., Ortega Soto E. 2003. 1alpha, 25-dihydroxy-vitamin D3 alters Syk activation through FcgammaRII in monocytic THP-1 cells. J. Cell. Biochem. 89:1056–1076 10.1002/jcb.10575 - DOI - PubMed
    1. Amir-Moazami O., Alexia C., Charles N., Launay P., Monteiro R.C., Benhamou M. 2008. Phospholipid scramblase 1 modulates a selected set of IgE receptor-mediated mast cell responses through LAT-dependent pathway. J. Biol. Chem. 283:25514–25523 10.1074/jbc.M705320200 - DOI - PubMed
    1. Bastie J.N., Balitrand N., Guidez F., Guillemot I., Larghero J., Calabresse C., Chomienne C., Delva L. 2004. 1 alpha,25-dihydroxyvitamin D3 transrepresses retinoic acid transcriptional activity via vitamin D receptor in myeloid cells. Mol. Endocrinol. 18:2685–2699 10.1210/me.2003-0412 - DOI - PubMed

Publication types

MeSH terms