. 2010 Apr 5;189(1):23-39.
doi: 10.1083/jcb.200912163.

CDK5RAP2 functions in centrosome to spindle pole attachment and DNA damage response

Affiliations

CDK5RAP2 functions in centrosome to spindle pole attachment and DNA damage response

Alexis R Barr et al. J Cell Biol. .

Abstract

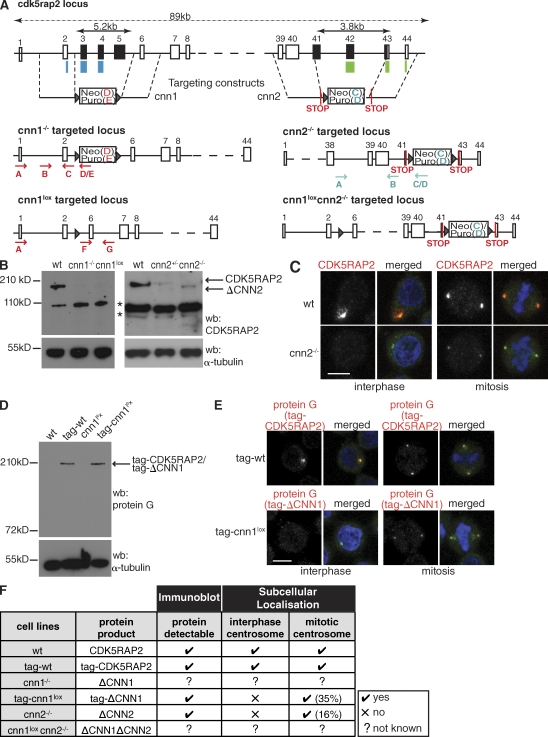
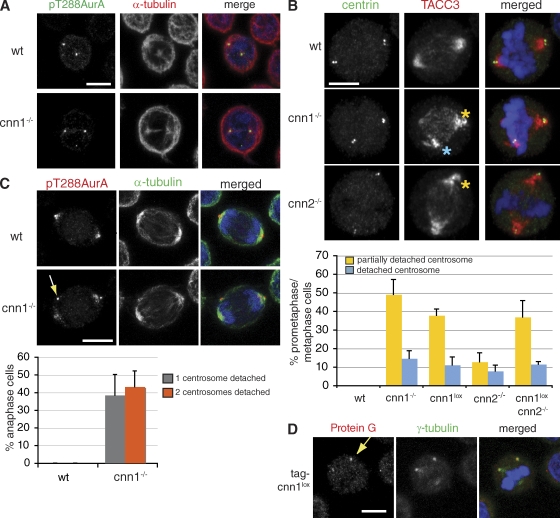
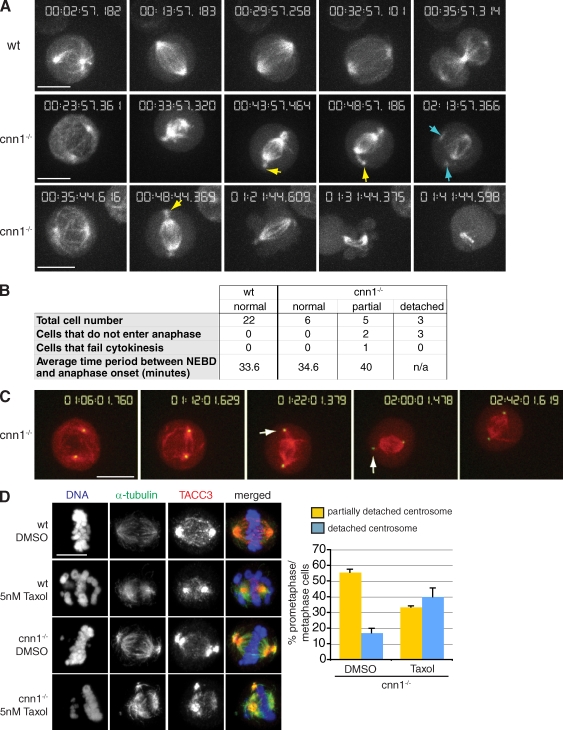
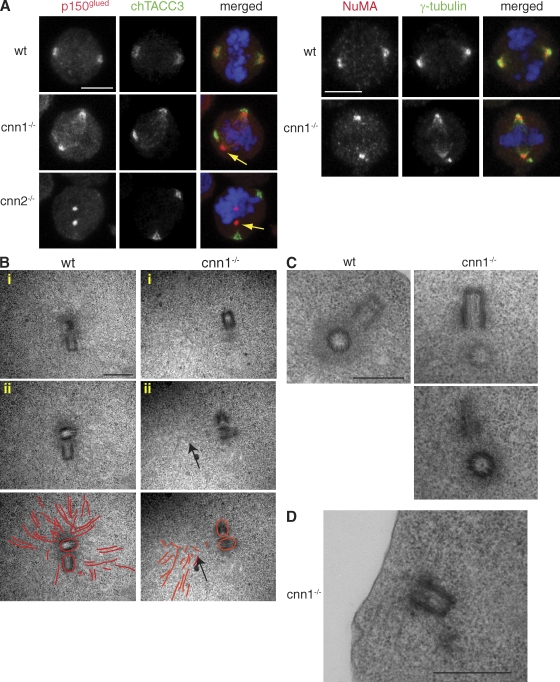
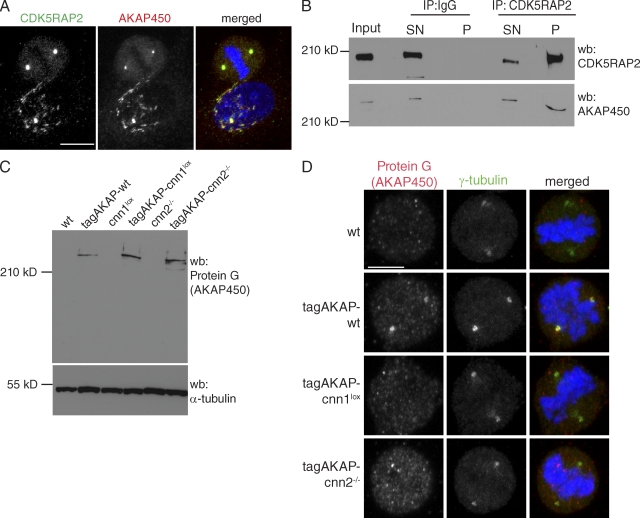
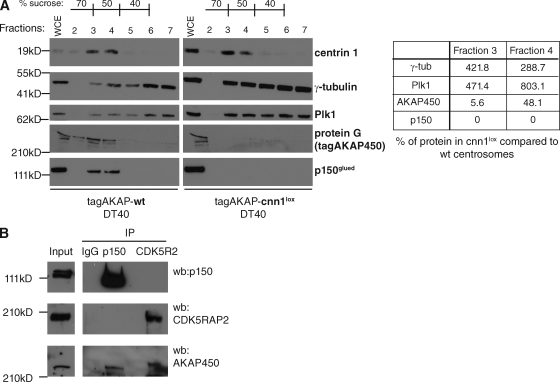
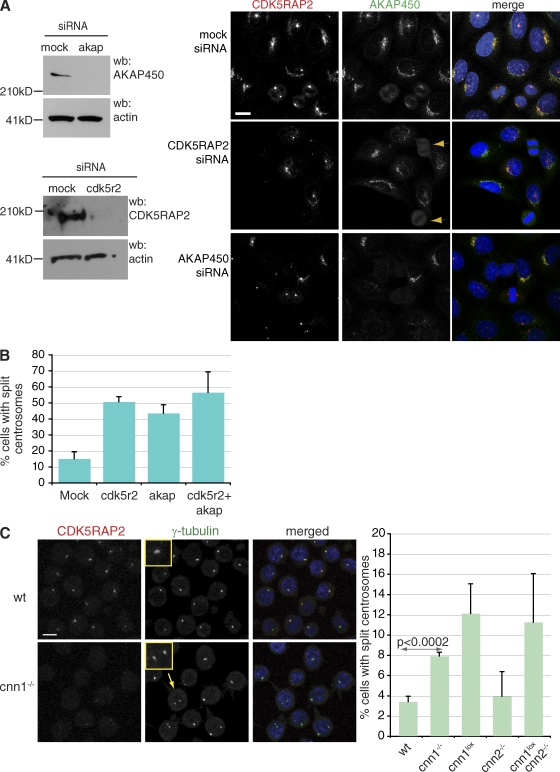
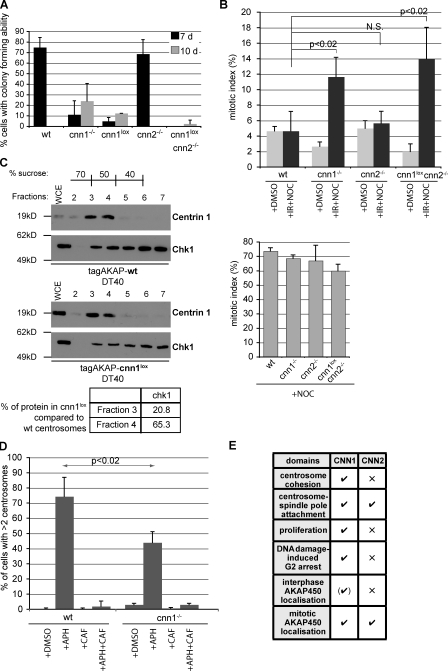
The centrosomal protein, CDK5RAP2, is mutated in primary microcephaly, a neurodevelopmental disorder characterized by reduced brain size. The Drosophila melanogaster homologue of CDK5RAP2, centrosomin (Cnn), maintains the pericentriolar matrix (PCM) around centrioles during mitosis. In this study, we demonstrate a similar role for CDK5RAP2 in vertebrate cells. By disrupting two evolutionarily conserved domains of CDK5RAP2, CNN1 and CNN2, in the avian B cell line DT40, we find that both domains are essential for linking centrosomes to mitotic spindle poles. Although structurally intact, centrosomes lacking the CNN1 domain fail to recruit specific PCM components that mediate attachment to spindle poles. Furthermore, we show that the CNN1 domain enforces cohesion between parental centrioles during interphase and promotes efficient DNA damage-induced G2 cell cycle arrest. Because mitotic spindle positioning, asymmetric centrosome inheritance, and DNA damage signaling have all been implicated in cell fate determination during neurogenesis, our findings provide novel insight into how impaired CDK5RAP2 function could cause premature depletion of neural stem cells and thereby microcephaly.


Figures

Figure 1.
Figure 1.
Disruption of the cdk5rap2 gene in DT40 cells. (A) Schematic representation of the gene-targeting strategies. The CNN1 domain maps to exons 2–4 of cdk5rap2 (blue bars). Exons 3–5 (black) were replaced by antibiotic-resistance cassettes. Antibiotic-resistance cassettes flanked by lox sites (triangles) were removed by Cre recombinase (cnn1lox). The CNN2 domain maps to exons 42–44 of cdk5rap2 (green bars). Exons 41–43 (black) were replaced by antibiotic-resistance cassettes flanked by in-frame STOP codons. The same targeting constructs were introduced into cnn1lox cells to create the cnn1loxcnn2−/− cells. (B) Western blots (wb) of wt and mutant cells. α-Tubulin serves as the loading control. Bands marked by asterisks are nonspecific because in situ tagging of CDK5RAP2 does not give rise to bands of these sizes (see D). (C) Subcellular localization of wt CDK5RAP2 and ΔCNN2. Blue, DNA; red, CDK5RAP2; green, γ-tubulin. (D) Western blot of wt, cnn1lox, tag-wt, and tag-cnn1lox cell extracts. tag-wt and tag-cnn1lox cells contain a protein G–encoding tag in one cdk5rap2 allele. α-Tubulin serves as the loading control. (E) Subcellular localization of tag-CDK5RAP2 and tag-ΔCNN1. Blue, DNA; red, protein G; green, γ-tubulin. (F) Summary of the mutant cdk5rap2 alleles generated. Not known means that these truncated protein products cannot be tracked because of disrupted antibody recognition sites. Percentages in brackets refer to the amount of protein at the centrosome relative to wt. Bars, 5 µm.
Figure 2.
Figure 2.
Centrosomes detach from mitotic spindle poles in cnn1−/− and cnn2−/− cells. (A) wt and cnn1−/− cells are indistinguishable in prophase. Blue, DNA; green, pT288Aur-A; red, α-tubulin. (B) In wt cells, anti–centrin-3 antibody staining colocalizes with spindle pole regions marked by anti-TACC3 antibody (top). In mutant cells, centrosomes partially (yellow asterisks) or fully (blue asterisk) detach from spindle poles. Blue, DNA; red, TACC3; green, centrin-3. The graph shows quantification of the centrosome phenotypes seen in prometaphase/metaphase cells. (C) In anaphase cnn1−/− cells, pT288Aur-A staining is located near the cortex away from the spindle poles (arrow). Blue, DNA; green, α-tubulin; red, pT288Aur-A. The graph shows quantification of centrosome phenotypes in anaphase cells. (D) Centrosomal levels of tag-ΔCNN1 protein do not correlate with centrosome detachment in tag-cnn1lox cells. Arrow marks a detached centrosome. Blue, DNA; green, γ-tubulin; red, protein G. n = 4; 150 cells per experiment. Error bars represent SD. Bars, 5 µm.
Figure 3.
Figure 3.
Centrosome detachment is dynamic and reversible in cnn1−/− cells. (A) Stills from time-lapse videos of wt (Video 1) and cnn1−/− (Videos 2 and 3) cells transfected with GFP-tubulin. Note that partially detached centrosomes (yellow arrows) appear soon after NEBD and precede the detached centrosome phenotype (blue arrows). (bottom) The cell shown initiates anaphase but fails to go through cytokinesis. (B) Summary of results from A. For cnn1−/− cells, mitotic timing and outcome are shown according to centrosome phenotypes. The criteria for classification were the following: partial, cells that developed partially detached centrosomes at any point during filming; detached, cells with at least one fully detached centrosome. The three cnn1−/− cells with detached centrosomes were followed for an average of 105 min after NEBD, but they failed to initiate anaphase during filming. (C) Stills from time-lapse video of cnn1−/− cells (Video 4) transfected with mCherry-tubulin (red) and GFP-PACT (green). (D) Low dose taxol treatment of wt and cnn1−/− cells. Blue, DNA; red, TACC3; green, α-tubulin. Centrosome phenotypes were scored in fixed cells. n = 2; at least 150 cells were counted per experiment. Error bars represent SD. Bars, 5 µm.
Figure 4.
Figure 4.
Mitotic spindle pole organization and centrosome structure are normal in cnn1−/− cells. (A) Spindle pole–organizing proteins, p150glued (left), and NuMA (right) localize normally in cnn1−/− and cnn2−/− cells even when centrosomes fully detach (yellow arrows). (left) Blue, DNA; red, p150; green, TACC3. (right) Blue, DNA; red, NuMA; green, γ-tubulin. Bars, 5 µm. (B) Transmission electron micrographs of serially sectioned prometaphase/metaphase cells. Two sections (i and ii) are shown for a single wt (left) and cnn1−/− cell (right). (bottom) Microtubules are highlighted in red to aid visualization. Higher magnification of electron micrographs and respective images of whole cells are shown in Fig. S3. Although a large number of microtubules focus in the wt centrosome, microtubules focus outside of the cnn1−/− centrosome (arrows). Note that these are likely to be spindle microtubules, as they occupy a position between the centrosomes and the chromosomes (see whole-field view in Fig. S3 B). (C) Both wt and cnn1−/− centrioles are surrounded by an electron-dense matrix. (D) This cnn1−/− centrosome is close to the cortex and associates with microtubule bundles. Bars, 500 nm.
Figure 5.
Figure 5.
CDK5RAP2 interacts with and targets AKAP450 to the centrosome. (A) CDK5RAP2 colocalizes with AKAP450 in HeLa cells. Blue, DNA; red, AKAP450; green, CDK5RAP2. Bar, 10 µm. (B) CDK5RAP2 coimmunoprecipitates with AKAP450 from HeLa cell extracts. A rabbit IgG mix was used as negative control. Input lane shows cytoplasmic extract before immunoprecipitation (IP). Input and supernatant correspond to 10% of the pellet. CDK5RAP2 antibody immunoprecipitated 26% of total CDK5RAP2 and 40% of total AKAP450 protein. The extent of CDK5RAP2 immunoprecipitation may be underestimated because the CDK5RAP2 signal is saturated. SN, supernatant; P, pellet. (C) Western blots (wb) of wt, cnn1lox, cnn2−/−, tagAKAP-wt tagAKAP-cnn1lox, and tagAKAP-cnn2−/− cell extracts. α-Tubulin serves as the loading control. (D) Anti–protein G antibody stains the mitotic centrosomes of tagAKAP-wt but not of tagAKAP-cnn1lox and tagAKAP-cnn2−/− cells. Blue, DNA; red, protein G (AKAP450); green, γ-tubulin. Bar, 5 µm.
Figure 6.
Figure 6.
The CNN1 domain is essential for targeting AKAP450 and p150glued to the centrosome. (A) Protein fractions of centrosomes purified from nocodazole-arrested tagAKAP-wt (left) or tagAKAP-cnn1lox (right) cells were immunoblotted with antibodies against centrin-1 and specific PCM components. Signal intensities in fractions 3 and 4 were normalized against the centrin signal in the same fraction. Table shows the percentage of each PCM component in tagAKAP-cnn1lox centrosomal fractions compared with tagAKAP-wt fractions. Whole cell extract (WCE) represents 0.15% of total cell extract; 50% of final centrosome pellet was loaded in each fraction. (B) AKAP450 coimmunoprecipitates with p150glued and CDK5RAP2 (CDK5R2) from mitotic extracts of nocodazole-arrested HeLa cells. A rabbit IgG mix was used as negative control. Input lane shows cytoplasmic extract before immunoprecipitation (IP). wb, Western blotting.
Figure 7.
Figure 7.
AKAP450 is required for centrosome cohesion. (A) Western blots (wb) showing siRNA-mediated depletion of CDK5RAP2 (CDK5R2) and AKAP450 (akap) in HeLa cells. Depletion of CDK5RAP2 does not interfere with the localization of AKAP450 to the Golgi and the centrosome during interphase, but it prevents its accumulation in the mitotic centrosome (arrowheads). Depletion of AKAP450 does not prevent the localization of CDK5RAP2 to the centrosome. Note that the Golgi disperses in AKAP450-depleted cells (Larocca et al., 2004), so CDK5RAP2 cannot accumulate in the Golgi. Blue, DNA; red, CDK5RAP2; green, AKAP450. Bar, 10 µm. (B) Graph shows quantification of centrosome splitting in mock and specific siRNA-treated cells. n = 3; at least 150 cells per experiment. (C) Centrosomes split in cnn1−/− DT40 cells. Anti-CDK5RAP2 antibody does not stain the centrosome in interphase cnn1−/− cells, but centrosomal γ-tubulin signal is comparable between wt and cnn1−/− centrosomes. Insets show close ups of normal (wt) and split (cnn1−/−) centrosomes. Blue, DNA; red, CDK5RAP2; green, γ-tubulin. Arrow marks the identity of the cell in inset. Bar, 5 µm. Graph shows quantification of centrosome splitting in wt and mutant cells (n = 4; 150 cells per experiment). P-values were calculated by two-tailed unpaired Student’s t test. Error bars represent SD.
Figure 8.
Figure 8.
CDK5RAP2 promotes G2 arrest in the presence of DNA damage. (A) Colony-forming ability of cells assayed 7 or 10 d after plating. n = 4; 40 cells per experiment. (B) Mitotic index was determined for wt and gene-disrupted DT40 cells that were incubated in DMSO for 10 h (+DMSO) or first irradiated with 20 Gy and then incubated in nocodazole for 10 h (+IR+NOC) or incubated in nocodazole for 10 h without irradiation (+NOC; bottom graph). n = 3; minimum of 3,000 cells was scored per condition per experiment for each genotype. P-values were calculated by two-tailed unpaired Student’s t test. (C) Levels of Chk1 protein are reduced in CNN1-deficient centrosomes. Protein fractions containing centrosomes purified from tagAKAP-wt or tagAKAP-cnn1lox cells (same purification as in Fig. 6 A) were immunoblotted with antibodies against centrin-1 and Chk1 kinase. Signal intensities of Chk1 in fractions 3 and 4 were normalized against the centrin signal in the same fraction. Table shows the percentage of Chk1 in tagAKAP-cnn1lox compared with tagAKAP-wt centrosomal fractions. WCE, whole cell extract. (D) 16 h treatment with aphidicolin (+APH) induces centrosome overduplication in DT40 cells. Caffeine alone (+CAF) or with aphidicolin (+APH+CAF) does not cause centrosome overduplication. Centrosome number was determined using γ-tubulin staining. Note that cnn1−/− cells contain slightly elevated centrosome numbers under all conditions. n = 3; at least 150 cells were scored per condition per experiment for each genotype. P-value was calculated by two-tailed unpaired Student’s t test. (E) Summary of the respective roles of the CNN1 and CNN2 domains in vertebrate cells. √, essential; ×, dispensable. Error bars represent SD.

References

    1. Andersen J.S., Wilkinson C.J., Mayor T., Mortensen P., Nigg E.A., Mann M. 2003. Proteomic characterization of the human centrosome by protein correlation profiling. Nature. 426:570–574 10.1038/nature02166 - DOI - PubMed
    1. Barr A.R., Gergely F. 2007. Aurora-A: the maker and breaker of spindle poles. J. Cell Sci. 120:2987–2996 10.1242/jcs.013136 - DOI - PubMed
    1. Barr A.R., Gergely F. 2008. MCAK-independent functions of ch-Tog/XMAP215 in microtubule plus-end dynamics. Mol. Cell. Biol. 28:7199–7211 10.1128/MCB.01040-08 - DOI - PMC - PubMed
    1. Barros T.P., Kinoshita K., Hyman A.A., Raff J.W. 2005. Aurora A activates D–TACC–Msps complexes exclusively at centrosomes to stabilize centrosomal microtubules. J. Cell Biol. 170:1039–1046 10.1083/jcb.200504097 - DOI - PMC - PubMed
    1. Bond J., Roberts E., Springell K., Lizarraga S.B., Lizarraga S., Scott S., Higgins J., Hampshire D.J., Morrison E.E., Leal G.F., et al. 2005. A centrosomal mechanism involving CDK5RAP2 and CENPJ controls brain size. Nat. Genet. 37:353–355 10.1038/ng1539 - DOI - PubMed

Publication types

Substances