

Spectral cytopathology of cervical samples: detecting cellular abnormalities in cytologically normal cells
- PMID: 20368702
- PMCID: PMC2894285
- DOI: 10.1038/labinvest.2010.72
Spectral cytopathology of cervical samples: detecting cellular abnormalities in cytologically normal cells
Abstract
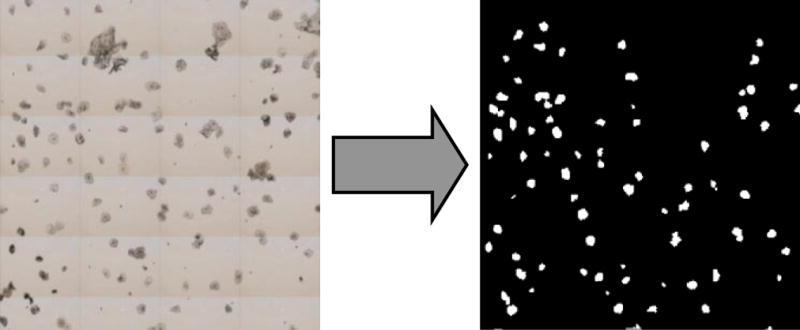
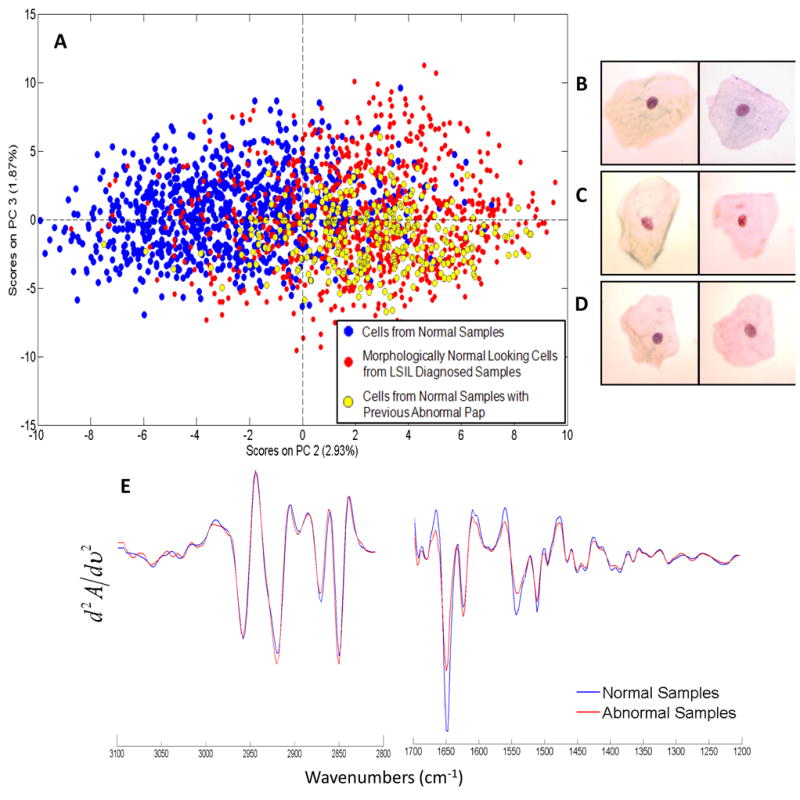
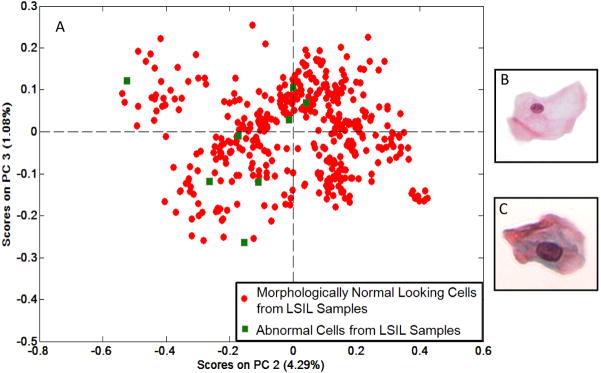
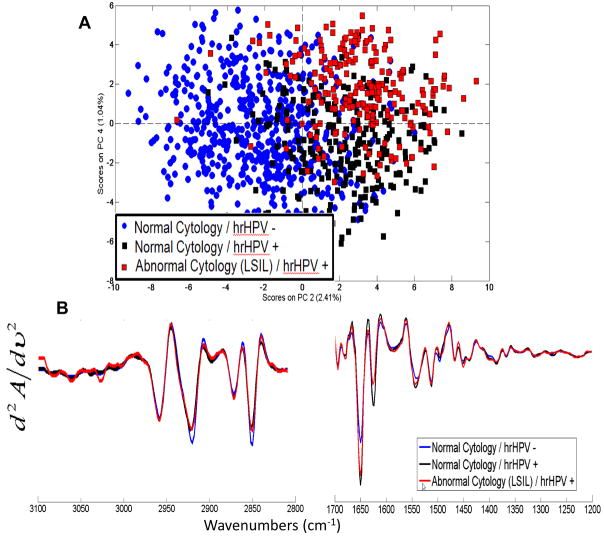
Spectral cytopathology (SCP) is a novel spectroscopic method for objective and unsupervised classification of individual exfoliated cells. The limitations of conventional cytopathology are well recognized within the pathology community. In SCP, cellular differentiation is made by observing molecular changes in the nucleus and the cytoplasm, which may or may not produce morphological changes detectable by conventional cytopathology. This proof of concept study shows SCP's potential as an enhancing tool for cytopathologists by aiding in the accurate and reproducible diagnosis of cells in all states of disease. Infrared spectra are collected from cervical cells deposited onto reflectively coated glass slides. Each cell has a corresponding infrared spectrum that describes its unique biochemical composition. Spectral data are processed and analyzed by an unsupervised chemometric algorithm, principal component analysis. In this blind study, cervical samples are classified by analyzing the spectra of morphologically normal looking squamous cells from normal samples and samples diagnosed by conventional cytopathology with low-grade squamous intraepithelial lesions. SCP discriminated cytopathological diagnoses amongst 12 different cervical samples with a high degree of specificity and sensitivity. SCP also correlated two samples with abnormal spectral changes: these samples had a normal cytopathological diagnosis but had a history of abnormal cervical cytology. The spectral changes observed in the morphologically normal looking cells are most likely because of an infection with human papillomavirus (HPV). HPV DNA testing was conducted on five additional samples, and SCP accurately differentiated these samples by their HPV status. SCP tracks biochemical variations in cells that are consistent with the onset of disease. HPV has been implicated as the cause of these changes detected spectroscopically. SCP does not depend on identifying the sparse number of morphologically abnormal cells within a large sample to make an accurate classification, as does conventional cytopathology. These findings suggest that the detection of cellular biochemical variations by SCP can serve as a new enhancing screening method that can identify earlier stages of disease.
Figures
References
-
- Papanicolaou GN, Traut H. The diagnostic value of vaginal smears in carcinoma of the uterus. Am J Obstet Gynecol. 1941;42:193–206. - PubMed
-
- Papanicolaou GN. New Cancer Diagnosis. Proceedings of the Third Race Betterment C; 1928. p. 528.
-
- Cervical Cancer. 2009. Jun, Available from:
-
- Evaluation of Cervical Cytology. Summary, Evidence Report/Technology Assessment. Jun, 2009. Available from: http://www.ahrq.gov/clinic/epcsums/cervsumm.htm. - PMC - PubMed
-
- Solomon D, Davey D, Kurman R, Moriarty A, O’Connor D, Prey M, et al. The 2001 Bethesda System Terminology for Reporting Results of Cervical Cytology. JAMA. 2002;287:2114–2119. - PubMed
Publication types
MeSH terms
Grants and funding
LinkOut - more resources
Full Text Sources
Other Literature Sources
Medical
