. 2010 Apr 2;5(4):e10011.
doi: 10.1371/journal.pone.0010011.

Enhanced beetle luciferase for high-resolution bioluminescence imaging

Affiliations

Enhanced beetle luciferase for high-resolution bioluminescence imaging

Yoshihiro Nakajima et al. PLoS One. .

Abstract

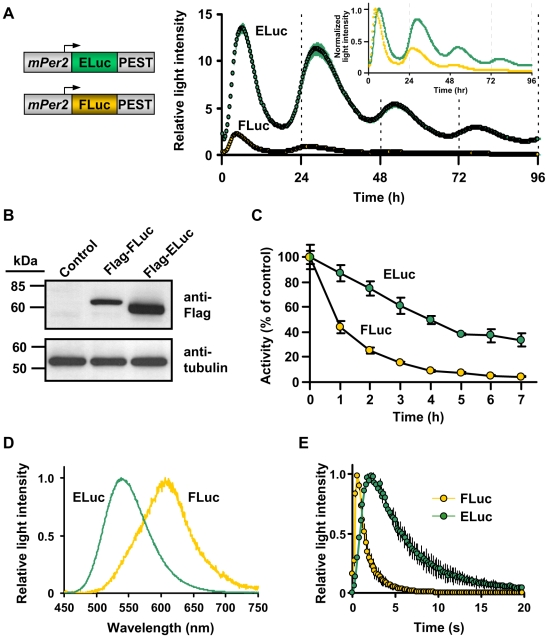
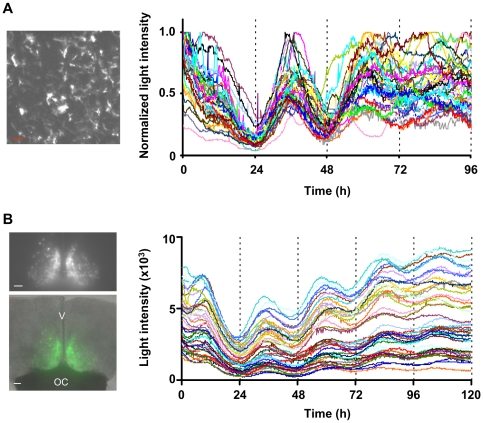
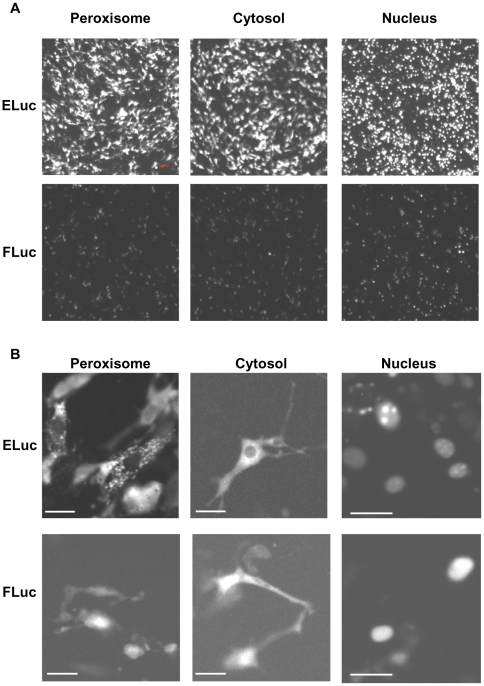
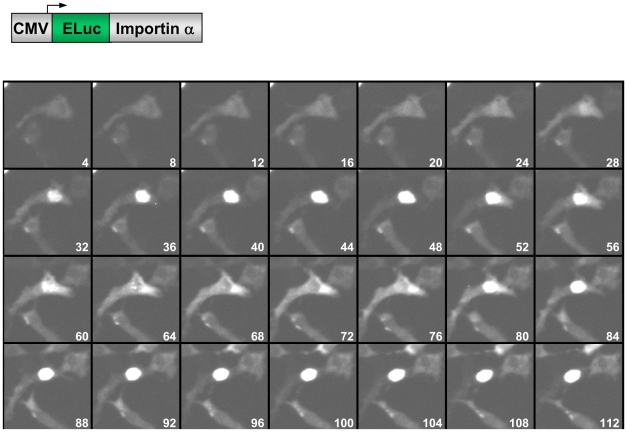
We developed an enhanced green-emitting luciferase (ELuc) to be used as a bioluminescence imaging (BLI) probe. ELuc exhibits a light signal in mammalian cells that is over 10-fold stronger than that of the firefly luciferase (FLuc), which is the most widely used luciferase reporter gene. We showed that ELuc produces a strong light signal in primary cells and tissues and that it enables the visualization of gene expression with high temporal resolution at the single-cell level. Moreover, we successfully imaged the nucleocytoplasmic shuttling of importin alpha by fusing ELuc at the intracellular level. These results demonstrate that the use of ELuc allows a BLI spatiotemporal resolution far greater than that provided by FLuc.


Conflict of interest statement

Competing Interests: TY and SN are employees of TOYOBO Corporation. Although TOYOBO Corporation did not provide direct financial support, it can be considered as an indirect funder for this study. TOYOBO Corporation manufactures and sells ELuc cDNA and reagents. Purchase and/or use of these are not restricted by patent right. The authors confirm that these competing interests do not alter their adherence to all the PLoS ONE policies on sharing data and materials.

Figures

Figure 1
Figure 1. Comparison of the characteristic properties of FLuc and ELuc in NIH3T3 cells.
(A) Photomultiplier recording of mPer2 transcriptional oscillation in NIH3T3 cells expressing destabilized ELuc (green filled circles) and FLuc (orange filled circles). The reporter plasmids mPer2-dELuc or mPer2-dFLuc were cotransfected with pCMV-CLuc and cells were stimulated with 100 nM of dexamethasone. The respective luciferase activities were normalized to CLuc activity. Error bars indicate the standard deviation (n = 4). The inset shows recordings in the case that the peak values of the curves were set to 1. Schematic drawings of the reporter plasmids are shown on the left. (B) Western blot analysis of FLuc and ELuc in NIH3T3 cells. The expression plasmids pCMV-Flag::FLuc or pCMV-Flag::ELuc were transfected into NIH3T3 cells, which were harvested and disrupted 48 h later. Both luciferases were detected using the anti-Flag M2 antibody. Tubulin was used as an internal control. The positions of molecular weight markers are indicated on the left margin of each panel. (C) Stability of destabilized FLuc (orange filled circles) and ELuc (green filled circles) in NIH3T3 cells. NIH3T3 cells were independently transfected with SV40-dFLuc or SV40-dELuc and the culture medium was replaced with DMEM supplemented with 10% FBS and 100 µM cycloheximide. After 20 min (time = 0), incubation was continued in DMEM supplemented with 10% FBS and 100 µM cycloheximide. At the indicated times, cells were disrupted and luciferase activity was measured. Error bars indicate the standard deviation (n = 6). (D) Emission spectra of FLuc (orange line) and ELuc (green line) in viable cells. NIH3T3 cells seeded in 35 mm dishes were transfected with pGVC2 (for FLuc) or pCMV-ELuc and incubated for 48 h. To obtain the spectra, the culture medium was replaced with DMEM without phenol red supplemented with 10% FBS and 200 µM D-luciferin, and incubated for 12 h. Spectra were then measured. (E) Kinetics of light production by purified FLuc (orange filled circles) and ELuc (green filled circles) exposed to D-luciferin, ATP and Mg2+. The peak values were set to 1. Error bars indicate the standard errors (n = 3).
Figure 2
Figure 2. Long-term single cell imaging of transcriptional oscillation in living cells using ELuc.
(A) Representative CCD image of mPer2 promoter-driven ELuc luminescence in rat primary astrocytes (scale bar, 100 µm) (left panel) and recordings of luminescence from 40 individual cells (right panel). Images were acquired using 9 min of exposure time at intervals of 10 min with a 4× objective lens (numerical aperture (NA), 0.5). Signals were normalized to maximum count. (B) CCD image of mBmal1 promoter-driven ELuc luminescence from SCN slices of Bmal1::ELuc transgenic mice (Bmal1-ELucA4, upper left panel) and merged photograph of bright-field and luminescence images (green) (lower left panel). Images were taken using 10 min exposures at intervals of 15 min and a 4× objective lens (scale bars, 100 µm). V and OC are third ventral and optic chiasm, respectively. Recordings of luminescence from 44 individual cells were plotted (right panel).
Figure 3
Figure 3. Representative luminescence CCD images of subcellular-targeted ELuc and FLuc in NIH3T3 cells.
(A) Luminescence images of peroxisome- (left panels), cytosol- (middle panels), and nucleus- (left panels) targeted ELuc (upper panels) and FLuc (bottom panels). Expression plasmids for the subcellular-targeted expression of luciferases under the control of the CMV promoter were transiently transfected into NIH3T3 cells. Images were acquired when the signals reached the maximum using 3 min of exposure time and a 4× objective lens without binning (scale bars, 100 µm). The contrast of all images was adjusted equally. (B) Luminescence images of the luciferase-expressing cells shown in A, as acquired with a 40× objective lens (NA, 0.9) (scale bars, 30 µm). Images were acquired using a 3 min exposure without binning.
Figure 4
Figure 4. Time-lapse luminescence imaging of the nucleocytoplasmic shuttling of ELuc::importin α in NIH3T3 cells.
The expression plasmid carrying ELuc::importin α was transiently transfected into NIH3T3 cells. Images were acquired after 3 h of transfection using 3 min of exposure time at intervals of 4 min with a 40× objective lens without binning. Numbers indicate minutes. A schematic drawing of the expression plasmid is shown on the upper panel.

References

    1. Wilson T, Hastings JW. Bioluminescence. Annu Rev Cell Dev Biol. 1998;14:197–230. - PubMed
    1. Greer LF, Szalay AA. Imaging of light emission from the expression of luciferases in living cells and organisms: a review. Luminescence. 2002;17:43–74. - PubMed
    1. Welsh DK, Kay SA. Bioluminescence imaging in living organisms. Curr Opin Biotechnol. 2005;16:73–78. - PubMed
    1. Roda A, Guardigli M, Michelini E, Mirasoli M. Bioluminescence in analytical chemistry and in vivo imaging. Trends Anal Chem. 2009;28:307–322.
    1. Viviani VR, Silva AC, Perez GL, Santelli RV, Bechara EJ, et al. Cloning and molecular characterization of the cDNA for the Brazilian larval click-beetle Pyrearinus termitilluminans luciferase. Photochem Photobiol. 1999;70:254–260. - PubMed

Publication types