. 2010 Apr 1;6(4):e1000888.
doi: 10.1371/journal.pgen.1000888.

Trait-associated SNPs are more likely to be eQTLs: annotation to enhance discovery from GWAS

Affiliations

Trait-associated SNPs are more likely to be eQTLs: annotation to enhance discovery from GWAS

Dan L Nicolae et al. PLoS Genet. .

Abstract

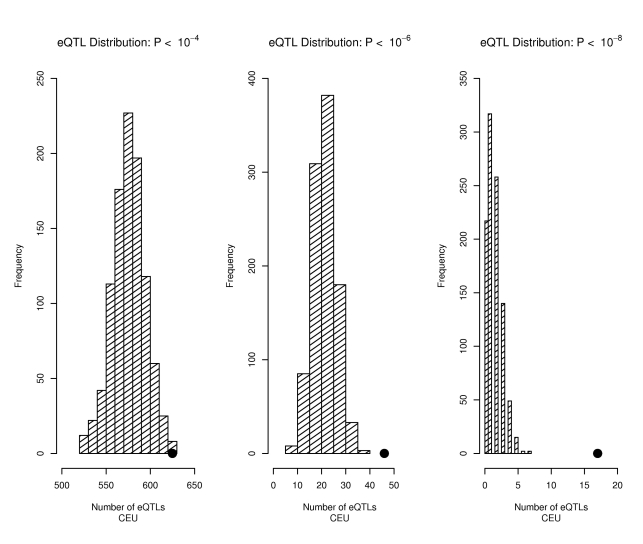
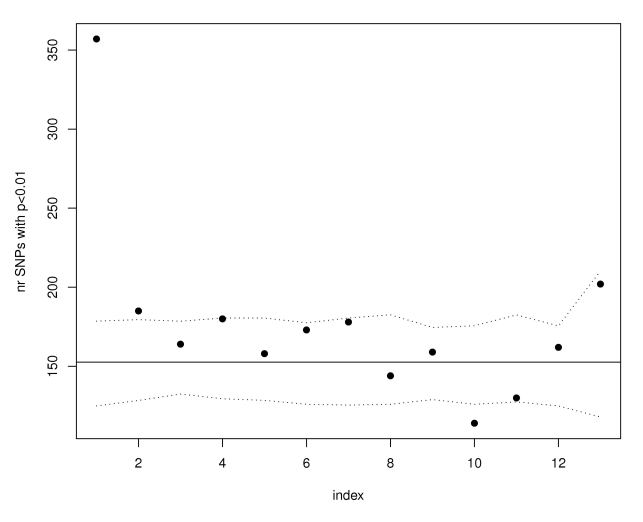
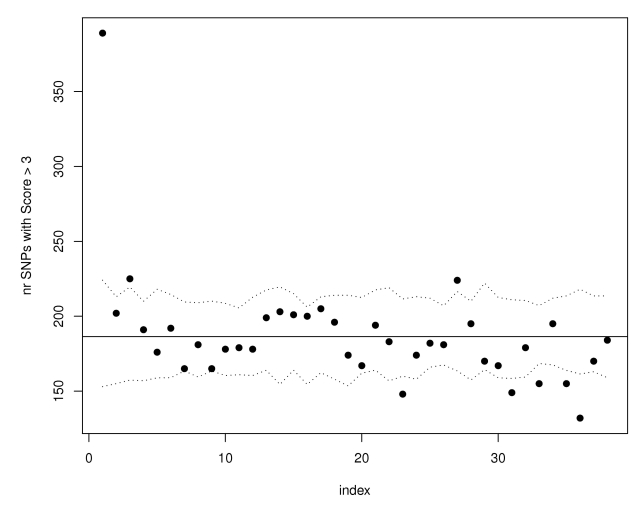
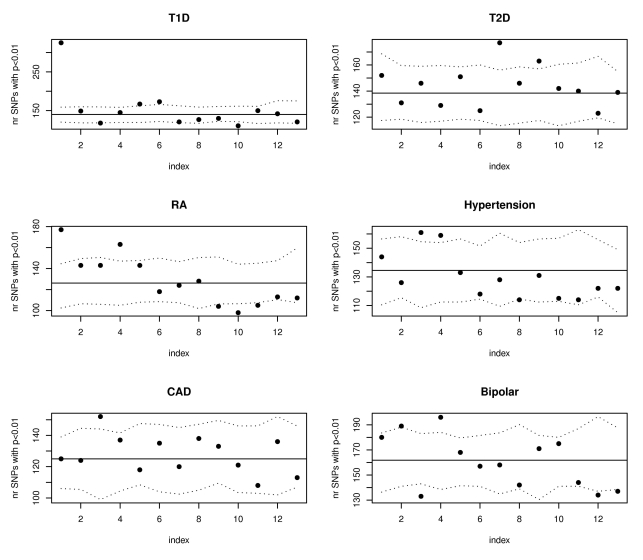
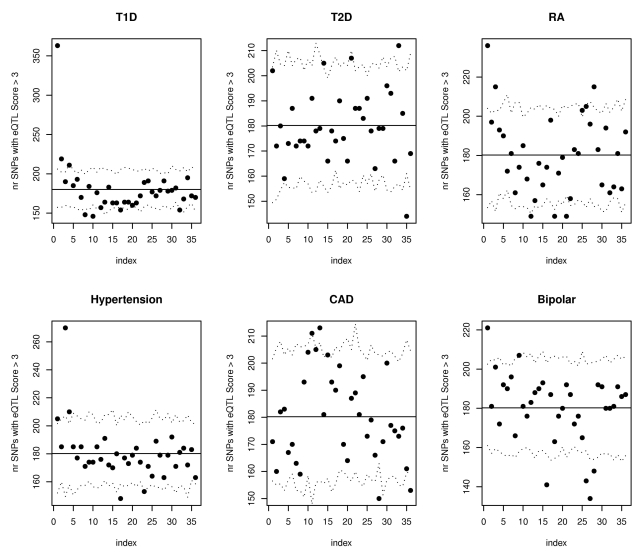
Although genome-wide association studies (GWAS) of complex traits have yielded more reproducible associations than had been discovered using any other approach, the loci characterized to date do not account for much of the heritability to such traits and, in general, have not led to improved understanding of the biology underlying complex phenotypes. Using a web site we developed to serve results of expression quantitative trait locus (eQTL) studies in lymphoblastoid cell lines from HapMap samples (http://www.scandb.org), we show that single nucleotide polymorphisms (SNPs) associated with complex traits (from http://www.genome.gov/gwastudies/) are significantly more likely to be eQTLs than minor-allele-frequency-matched SNPs chosen from high-throughput GWAS platforms. These findings are robust across a range of thresholds for establishing eQTLs (p-values from 10(-4)-10(-8)), and a broad spectrum of human complex traits. Analyses of GWAS data from the Wellcome Trust studies confirm that annotating SNPs with a score reflecting the strength of the evidence that the SNP is an eQTL can improve the ability to discover true associations and clarify the nature of the mechanism driving the associations. Our results showing that trait-associated SNPs are more likely to be eQTLs and that application of this information can enhance discovery of trait-associated SNPs for complex phenotypes raise the possibility that we can utilize this information both to increase the heritability explained by identifiable genetic factors and to gain a better understanding of the biology underlying complex traits.


Conflict of interest statement

The authors have declared that no competing interests exist.

Figures

Figure 1
Figure 1. Trait-associated SNPs are more likely to be eQTLs.
The distribution of the number of eQTLs (defined as p<10−4 left panel, p<10−6 middle panel, and p<10−8 right panel) observed for each of 1,000 draws of 1,598 SNPs from bins matched for minor allele frequency to the 1,598 SNPs downloaded from the NHGRI catalog (bins include all SNPs in the Illumina 1M and Affymetrix 6.0 products) is shown in the bar graphs, with the actual number of eQTLs observed in the 1,598 SNPs from the NHGRI catalog shown as a solid circle.
Figure 2
Figure 2. SNPs with the highest eQTL function scores are enriched for WTCCC Crohn's susceptibility loci.
SNPs were ordered according to their eQTL function scores from most significant to least significant and divided in groups of 10,000. Only the data from the first 13 groups is shown (as 13 index bins along the X-axis) because fewer than 130K SNPs have expression scores larger than zero. Each point in the graph corresponds to eQTL function score bins and the y-axis shows the number of SNPs in each bin that have WTCCC Crohn's GWAS p-values less than 0.01. The horizontal line illustrates the expectation based on the observed number of SNPs in the whole GWAS that have p-values smaller than 0.01. The proportion of the remaining SNPs with p smaller than 0.01 is 0.014. The dotted lines represent estimated 95% confidence bands obtained using simulations.
Figure 3
Figure 3. SNPs with the strongest evidence for association in WTCCC Crohn's disease are more likely to have eQTL function scores >3.
SNPs have been ordered according to their WTCCC Crohn's association p-values from the most to the least significant, and divided in groups of 10,000. For each group bin of 10,000 trait-associated SNPs, the number of SNPs with expression score larger than 3 was calculated and the results are shown in the scatterplot. The horizontal line illustrates the expectation based on the observed eQTL function scores in all SNPs in the WTCCC Crohn's dataset. The dotted lines represent estimated 95% confidence bands obtained using simulations.
Figure 4
Figure 4. SNPs with the highest eQTL function scores are enriched for WTCCC T1D and RA susceptibility loci.
The plots show results of eQTL enrichment analyses for the remaining Wellcome Trust phenotypes beginning with SNPs having the highest expression scores (similar to analyses for Crohn's disease summarized in Figure 2). SNPs have been ordered according to their expression score from most significant to least significant and divided in groups of 10,000. Only the data from the first 13 groups is shown. The six plots correspond to the six other diseases investigated in the initial WTCCC GWAS. The dotted lines represent estimated 95% confidence bands obtained using simulations.
Figure 5
Figure 5. SNPs with the strongest evidence for association with WTCCC T1D, RA, hypertension, and bipolar disorder are more likely to have eQTL function scores >3.
The plots show results of eQTL enrichment analysis for the remaining Wellcome Trust phenotypes beginning with the SNPs most strongly associated with disease (similar to analyses for Crohn's disease summarized in Figure 3). For each disease, SNPs have been ordered according to their association p-values from the most to the least significant, and divided in groups of 10,000. For each group, the number of SNPs with expression score larger than 3 was calculated and the results are shown in the scatterplots. The horizontal lines illustrate the expectation based on the observed scores in all SNPs in the relevant WTCCC dataset. The dotted lines represent estimated 95% confidence bands obtained using simulations.

References

    1. Coleman HR, Chan CC, Ferris FL, 3rd, Chew EY. Age-related macular degeneration. Lancet. 2008;372:1835–1845. - PMC - PubMed
    1. Barrett JC, Hansoul S, Nicolae DL, Cho JH, Duerr RH, et al. Genome-wide association defines more than 30 distinct susceptibility loci for Crohn's disease. Nat Genet. 2008;40:955–962. - PMC - PubMed
    1. Klionsky DJ. Crohn's disease, autophagy, and the Paneth cell. N Engl J Med. 2009;360:1785–1786. - PMC - PubMed
    1. Hampe J, Franke A, Rosenstiel P, Till A, Teuber M, et al. A genome-wide association scan of nonsynonymous SNPs identifies a susceptibility variant for Crohn disease in ATG16L1. Nat Genet. 2007;39:207–211. - PubMed
    1. Manolio TA, Collins FS, Cox NJ, Goldstein DB, Hindorff LA, et al. Finding the missing heritability of complex diseases. Nature. 2009;461:747–753. - PMC - PubMed

Publication types