. 2010:2010:307231.
doi: 10.1155/2010/307231. Epub 2010 Mar 30.

TNFalpha induces choroid plexus epithelial cell barrier alterations by apoptotic and nonapoptotic mechanisms

Affiliations

TNFalpha induces choroid plexus epithelial cell barrier alterations by apoptotic and nonapoptotic mechanisms

Christian Schwerk et al. J Biomed Biotechnol. 2010.

Abstract

The choroid plexus epithelium constitutes the structural basis of the blood-cerebrospinal fluid barrier. Since the cytokine TNFalpha is markedly increased during inflammatory diseases in the blood and the central nervous system, we investigated by which mechanisms TNFalpha induces barrier alteration in porcine choroid plexus epithelial cells. We found a dose-dependent decrease of transepithelial electrical resistance, increase of paracellular inulin-flux, and induction of histone-associated DNA fragmentation and caspase-3 activation after TNFalpha stimulation. This response was strongly aggravated by the addition of cycloheximide and could partially be inhibited by the NF-kappaB inhibitor CAPE, but most effectively by the pan-caspase-inhibitor zVAD-fmk and not by the JNK inhibitor SP600125. Partial loss of cell viability could also be attenuated by CAPE. Immunostaining showed cell condensation and nuclear binding of high-mobility group box 1 protein as a sign of apoptosis after TNFalpha stimulation. Taken together our findings indicate that TNFalpha compromises PCPEC barrier function by caspase and NF-kappaB dependent mechanisms.


Figures

Figure 1
Figure 1
Apical and basolateral TNFα stimulations induce an equal effect on PCPEC barrier function. PCPECs grown on Transwell filters were stimulated apically (a) or basolaterally (b) with different doses of TNFα (1, 10, 100 ng/mL) with or without the protein synthesis inhibitor cycloheximide (1 μg/mL). Effects on barrier function by measuring Transepithelial electrical resistance (TEER) were determined at 24 hours. The TEER results are expressed as a percentage of baseline. The data shown are mean ± SEM of four independent experiments, each performed in duplicate.
Figure 2
Figure 2
TNFα-induced decrease of TEER in PCPEC is caspase- and NF-κB-dependent. Effects of the pan-caspase inhibitor zVAD-fmk (10 μM), the NF-κB inhibitor CAPE (5 μM), and the JNK-inhibitor SP600125 (10 μM) on TNFα-induced decrease of TEER in PCPEC were determined at 24 hours. PCPECs were stimulated apically with TNFα (100 ng/mL) with (b) or without (a) cycloheximide (1 μg/mL). The TEER results are expressed as a percentage of baseline. The data shown are mean ± SEM of four independent experiments, each performed in duplicate. #P-value of < .05 compared to TNFα stimulated PCPEC without inhibitor; *P-value of < .05 compared to unstimulated PCPEC.
Figure 3
Figure 3
TNFα-induced increase of paracellular inulin flux in PCPEC is caspase- and NF-κB-dependent. Effects of the pan-caspase inhibitor zVAD (10 μM), the NF-κB inhibitor CAPE (5 μM), and the JNK-inhibitor SP600125 (10 μM) on TNFα-induced increase of paracellular FITC-inulin flux in PCPECs were determined at 24 hours. The FITC-inulin flux was measured in the apical-to-basolateral direction with or without stimulation and is expressed as percentage of tracer in the basolateral compartment. PCPEC were stimulated apically with TNFα (100 ng/mL) with (b) or without (a) cycloheximide (1 μg/mL). The data shown are mean ± SEM of four independent experiments, each performed in duplicate. #P-value of <.05 compared to TNFα stimulated PCPEC without inhibitor; *P-value of < .05 compared to unstimulated PCPEC.
Figure 4
Figure 4
TNFα induces DNA-fragmentation in PCPEC. TNFα-induced apoptosis was determined by ELISA measuring the number of cellular histone-associated DNA fragments. (a) The concentration of histone-associated DNA-fragments was determined 8 hours, 24 hours, and 48 hours following apical stimulation with TNFα. PCPEC were stimulated apically with TNFα (100 ng/mL) alone or costimulated with cycloheximide (1 μg/mL). The data shown are mean ± SEM of three independent experiments, each performed in duplicate. (b) Appearance of histone-associated DNA fragments after 24 hours treatment with different doses of TNFα (1, 10, 100 ng/mL) in presence or absence of cycloheximide (1 μg/mL). A representative experiment out of three performed in duplicates is shown. OD, optical density.
Figure 5
Figure 5
Caspase inhibition prevents TNFα-induced DNA fragmentation. Influences of inhibitors of caspases, NF-κB, and JNK were analyzed in respect to TNFα-induced PCPEC DNA fragmentation. PCPECs were stimulated apically with TNFα (100 ng/mL) with (b) or without (a) cycloheximide (1 μg/mL). Cells were additionally preincubated with zVAD (10 μM), CAPE (5 μM) or SP600125 (10 μM) for 2 hours as indicated. Results of these experiments were measured as an optical density (OD). The data shown are mean ± SEM of three independent experiments, each performed in duplicate; #P-value of < .05 compared to treated PCPEC without inhibitor.
Figure 6
Figure 6
TNFα strongly activates caspase-3 in PCPEC. Caspase-3 activation (given as change of fluorescence per minute in arbitrary units (ΔFU/min.)) was measured in PCPEC after stimulation with TNFα (100 ng/mL) for 24 hours with and without zVAD (10 μM), CAPE (5 μM) or SP600125 (10 μM) preincubation for 2 hours (a), and coincubation with cycloheximide (CHX) (1 μg/mL) (b) and unstimulated control. The data shown are mean ± SEM of three independent experiments (n = 3), each performed in duplicates. *P-value of < .05 compared to unstimulated PCPEC; #P-value of < .05 compared to TNFα ± CHX stimulated PCPEC without inhibitor.
Figure 7
Figure 7
Inhibition of NF-kB induction attenuates PCPEC cytotoxicity. Cytotoxicity in the presence of TNFα (100 ng/mL) ± cycloheximide (CHX) (1 μg/mL) ((a) and (b)) for 24 hours, was detected by measuring LDH activity in the supernatant. Cytotoxicity inhibition experiments in PCPEC cells were performed after preincubation with zVAD-fmk (10 μM), CAPE (5 μM) or SP600125 (10 μM) for 2-hour. The data are expressed as the percentages of cytotoxicity in treated wells compared with cytotoxicity in control wells with PCPEC alone. The data shown are mean ± SEM of three independent experiments, each performed in duplicate. *P-value of < .05 compared to unstimulated PCPEC; #P-value of < .05 compared to TNFα ± CHX stimulated PCPEC without inhibitor.
Figure 8
Figure 8
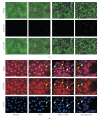
TNFα induces HMGB1 release as well as HBGB1 binding in PCPEC. TNFα-stimulated PCPEC loose membrane integrity. PCPEC were stimulated with TNFα (100 ng/mL) ± cycloheximide (CHX) (1 μg/mL) for 10 hours. For a positive control PCPECs were treated with staurosporine (1 μM). (a) Adherent cells were labelled according to the Live/Dead assay protocol. Vital cells are penetrated by calcein and show a green fluorescence, damaged cells were penetrated by ethidium homodimer and show red fluorescent nuclei. Images were obtained by fluorescence microscopy (400 × magnification) using a digital camera. (b) Chromatin of vital and apoptotic cells binds HMGB1 (red) whereas TNFα ± CHX and staurosporine stimulated PCPEC partly released HMGB1 from nuclei (i.e., post-apoptotic necrosis; white arrows). DAPI staining revealed also that TNFα ± cycloheximide (CHX) resulted in chromatin condensation in PCPEC and binding of HMGB1 (i.e., apoptosis; yellow arrows). Both were detected by fluorescence microscopy (1000 × magnification) and photographs were taken using a digital camera. The whole well was examined for each experimental condition in two separate experiments; results from one representative experiment are shown.

Similar articles

Cited by

References

    1. Strazielle N, Ghersi-Egea J-F. Choroid plexus in the central nervous system: biology and physiopathology. Journal of Neuropathology and Experimental Neurology. 2000;59(7):561–574. - PubMed
    1. Engelhardt B, Wolburg-Buchholz K, Wolburg H. Involvement of the choroid plexus in central nervous system inflammation. Microscopy Research and Technique. 2001;52(1):112–129. - PubMed
    1. Balda MS, Matter K. Tight junctions. Journal of Cell Science. 1998;111(5):541–547. - PubMed
    1. Denker BM, Nigam SK. Molecular structure and assembly of the tight junction. American Journal of Physiology. 1998;274(1):F1–F9. - PubMed
    1. Gray LD, Fedorko DP. Laboratory diagnosis of bacterial meningitis. Clinical Microbiology Reviews. 1992;5(2):130–145. - PMC - PubMed

Publication types