

Genome-wide association analysis of total cholesterol and high-density lipoprotein cholesterol levels using the Framingham heart study data
- PMID: 20370913
- PMCID: PMC2867786
- DOI: 10.1186/1471-2350-11-55
Genome-wide association analysis of total cholesterol and high-density lipoprotein cholesterol levels using the Framingham heart study data
Abstract
Background: Cholesterol concentrations in blood are related to cardiovascular diseases. Recent genome-wide association studies (GWAS) of cholesterol levels identified a number of single-locus effects on total cholesterol (TC) and high-density lipoprotein cholesterol (HDL-C) levels. Here, we report single-locus and epistasis SNP effects on TC and HDL-C using the Framingham Heart Study (FHS) data.
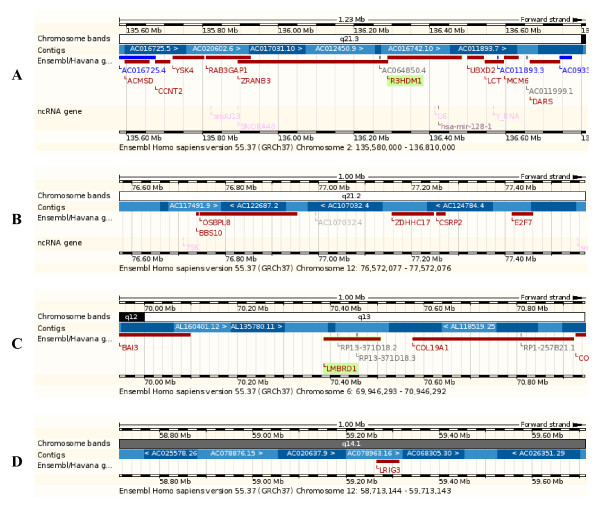
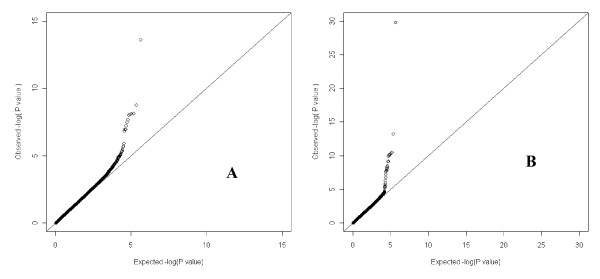
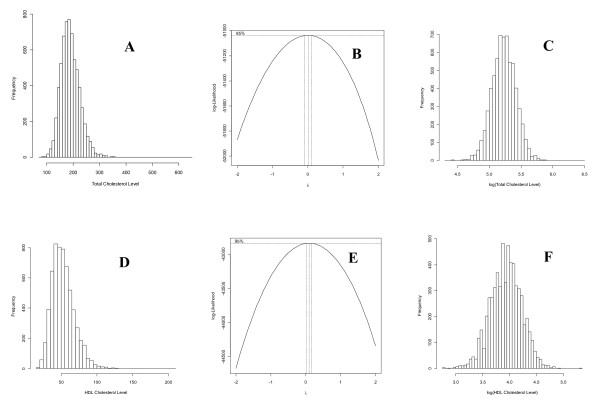
Results: Single-locus effects and pairwise epistasis effects of 432,096 SNP markers were tested for their significance on log-transformed TC and HDL-C levels. Twenty nine additive SNP effects reached single-locus genome-wide significance (p < 7.2 x 10⁻⁸) and no dominance effect reached genome-wide significance. Two new gene regions were detected, the RAB3GAP1-R3HDM1-LCT-MCM6 region of chr02 for TC identified by six new SNPs, and the OSBPL8-ZDHHC17 region (chr12) for HDL-C identified by one new SNP. The remaining 22 single-locus SNP effects confirmed previously reported genes or gene regions. For TC, three SNPs identified two gene regions that were tightly linked with previously reported genes associated with TC, including rs599839 that was 10 bases downstream PSRC1 and 3.498 kb downstream CELSR2, rs4970834 in CELSR2, and rs4245791 in ABCG8 that slightly overlapped with ABCG5. For HDL-C, LPL was confirmed by 12 SNPs 8-45 kb downstream, CETP by two SNPs 0.5-11 kb upstream, and the LIPG-ACAA2 region by five SNPs inside this region. Two epistasis effects on TC and thirteen epistasis effects on HDL-C reached the significance of "suggestive linkage". The most significant epistasis effect (p = 5.72 x 10⁻¹³) was close to reaching "significant linkage" and was a dominance x dominance effect of HDL-C between LMBRD1 (chr06) and the LRIG3 region (chr12), and this pair of gene regions had six other D x D effects with "suggestive linkage".
Conclusions: Genome-wide association analysis of the FHS data detected two new gene regions with genome-wide significance, detected epistatic SNP effects on TC and HDL-C with the significance of suggestive linkage in seven pairs of gene regions, and confirmed some previously reported gene regions associated with TC and HDL-C.
Figures
References
-
- Aulchenko YS, Ripatti S, Lindqvist I, Boomsma D, Heid IM, Pramstaller PP, Penninx BWJH, Janssens ACJW, Wilson JF, Spector T, Martin NG, Pedersen NL, Kyvik KO, Kaprio J, Hofman A, Freimer NB, Jarvelin MR, Gyllensten U, Campbell H, Rudan I, Johansson A, Marroni F, Hayward C, Vitart V, Jonasson I, Pattaro C, Wright A, Hastie N, Pichler I, Hicks AA, Falchi M, Willemsen G, Hottenga JJ, De Geus EJC, Montgomery GW, Whitfield J, Magnusson P, Saharinen J, Perola M, Silander K, Isaacs A, Sijbrands EJG, Uitterlinden AG, Witteman JCM, Oostra BA, Elliott P, Ruokonen A, Sabatti C, Gieger C, Meitinger T, Kronenberg F, Döring A, Wichmann HE, Smit JH, McCarthy MI, Duijn CM, Leena. Loci influencing lipid levels and coronary heart disease risk in 16 European population cohorts. Nat Genet. 2008;41:47–55. doi: 10.1038/ng.269. - DOI - PMC - PubMed
-
- Kathiresan S, Willer CJ, Peloso GM, Demissie S, Musunuru K, Schadt EE, Kaplan L, Bennett D, Li Y, Tanaka T, Voight BF, Bonnycastle LL, Jackson AU, Crawford G, Surti A, Guiducci C, Burtt NP, Parish S, Clarke R, Zelenika D, Kubalanza KA, Morken MA, Scott LJ, Stringham HM, Galan P, Swift AJ, Kuusisto J, Bergman RN, Sundvall J, Laakso M, Ferrucci L, Scheet P, Sanna S, Uda M, Yang Q, Lunetta KL, Dupuis J, De Bakker PIW, O'Donnell CJ, Chambers JC, Kooner JS, Hercberg S, Meneton P, Lakatta EG, Scuteri A, Schlessinger D, Tuomilehto J, Collins FS, Groop L, Altshuler D, Collins R, Lathrop GM, Melander O, Salomaa V, Peltonen L, Orho-Melander M, Ordovas JM, Boehnke M, Abecasis GR, Mohlke KL, Cupples LA. Common variants at 30 loci contribute to polygenic dyslipidemia. Nat Genet. 2008;41:56–65. doi: 10.1038/ng.291. - DOI - PMC - PubMed
-
- Kathiresan S, Melander O, Guiducci C, Surti A, Burtt NP, Rieder MJ, Cooper GM, Roos C, Voight BF, Havulinna AS, Wahlstrand B, Hedner T, Corella D, Tai ES, Ordovas JM, Berglund G, Vartiainen E, Jousilahti P, Hedblad B, Taskinen M-R, Newton-Cheh C, Salomaa V, Peltonen L, Groop L, Altshuler DM, Orho-Melander M. Six new loci associated with blood low-density lipoprotein cholesterol, high-density lipoprotein cholesterol or triglycerides in humans. Nat Genet. 2008;40:189–197. doi: 10.1038/ng.75. - DOI - PMC - PubMed
-
- Willer CJ, Sanna S, Jackson AU, Scuteri A, Bonnycastle LL, Clarke R, Heath SC, Timpson NJ, Najjar SS, Stringham HM, Strait J, Duren WL, Maschio A, Busonero F, Mulas A, Albai G, Swift AJ, Morken MA, Narisu N, Bennett D, Parish S, Shen H, Galan P, Meneton P, Hercberg S, Zelenika D, Chen WM, Li Y, Scott LJ, Scheet PA, Sundvall J, Watanabe RM, Nagaraja R, Ebrahim S, Lawlor DA, Ben-Shlomo Y, Davey-Smith G, Shuldiner AR, Collins R, Bergman RN, Uda M, Tuomilehto J, Cao A, Collins FS, Lakatta E, Lathrop GM, Boehnke M, Schlessinger D, Mohlke KL, Abecasis GR. Newly identified loci that influence lipid concentrations and risk of coronary artery disease. Nat Genet. 2008;40:161–169. doi: 10.1038/ng.76. - DOI - PMC - PubMed
-
- Karvanen J, Silander K, Kee F, Tiret L, Salomaa V, Kuulasmaa K, Wiklund PG, Virtamo J, Saarela O, Perret C, Perola M, Peltonen L, Cambien F, Erdmann J, Samani NJ, Schunkert H, Evans A. The impact of newly identified loci on coronary heart disease, stroke and total mortality in the MORGAM prospective cohorts. Genet Epidemiol. 2009;33:237–246. doi: 10.1002/gepi.20374. - DOI - PMC - PubMed
Publication types
MeSH terms
Substances
LinkOut - more resources
Full Text Sources
Other Literature Sources
Medical
Research Materials
Miscellaneous
